Viewing the HECI in PIT
You can view HECI output in Layers and Reports. HECI scores are available as a monitor for reporting to see how recommended treatments could affect the HECI score for years following the treatment. The monitor shows yearly progression with the proportion of the HECI in each colour band.
Horizons updates the HECI with each quarterly data refresh. See About the Highways England Condition Indicator.
Horizons classifies output into the following bands for simplified viewing.
| Banding | Threshold | Interpretation |
|---|---|---|
| Green | HECI < 40 | No treatment recommended |
| Amber | HECI >= 40 and HECI < 100 | Resurfacing recommended |
| Red | HECI = 100 | 100mm Inlay or greater recommended |
To view the HECI on the map
- In Explorer, click the Layers icon.
- Locate the required HECI Run folder, and click the folder name to see HECI Layers for each refresh version.
- Click the Layer for the required system refresh.
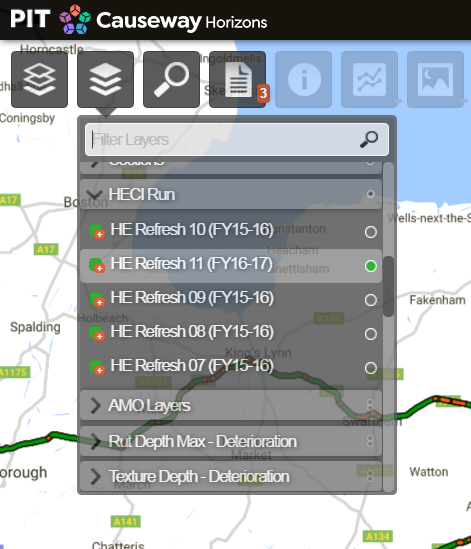
The HECI results appear on the map.
To view a HECI report
- In Explorer, select the HECI Layer required for the report.
- Click the Reports icon. The list of Layers to report on drops down.
- Select the required report from the folder.
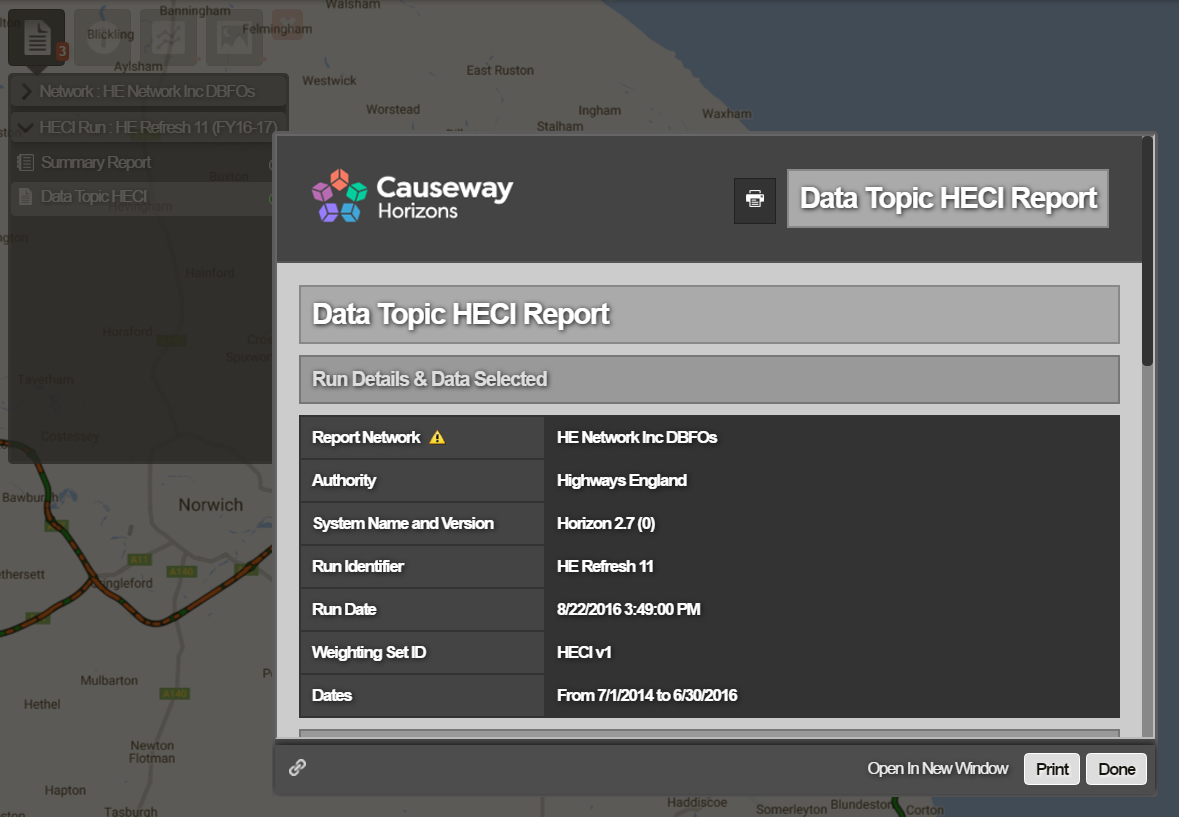
The report opens.
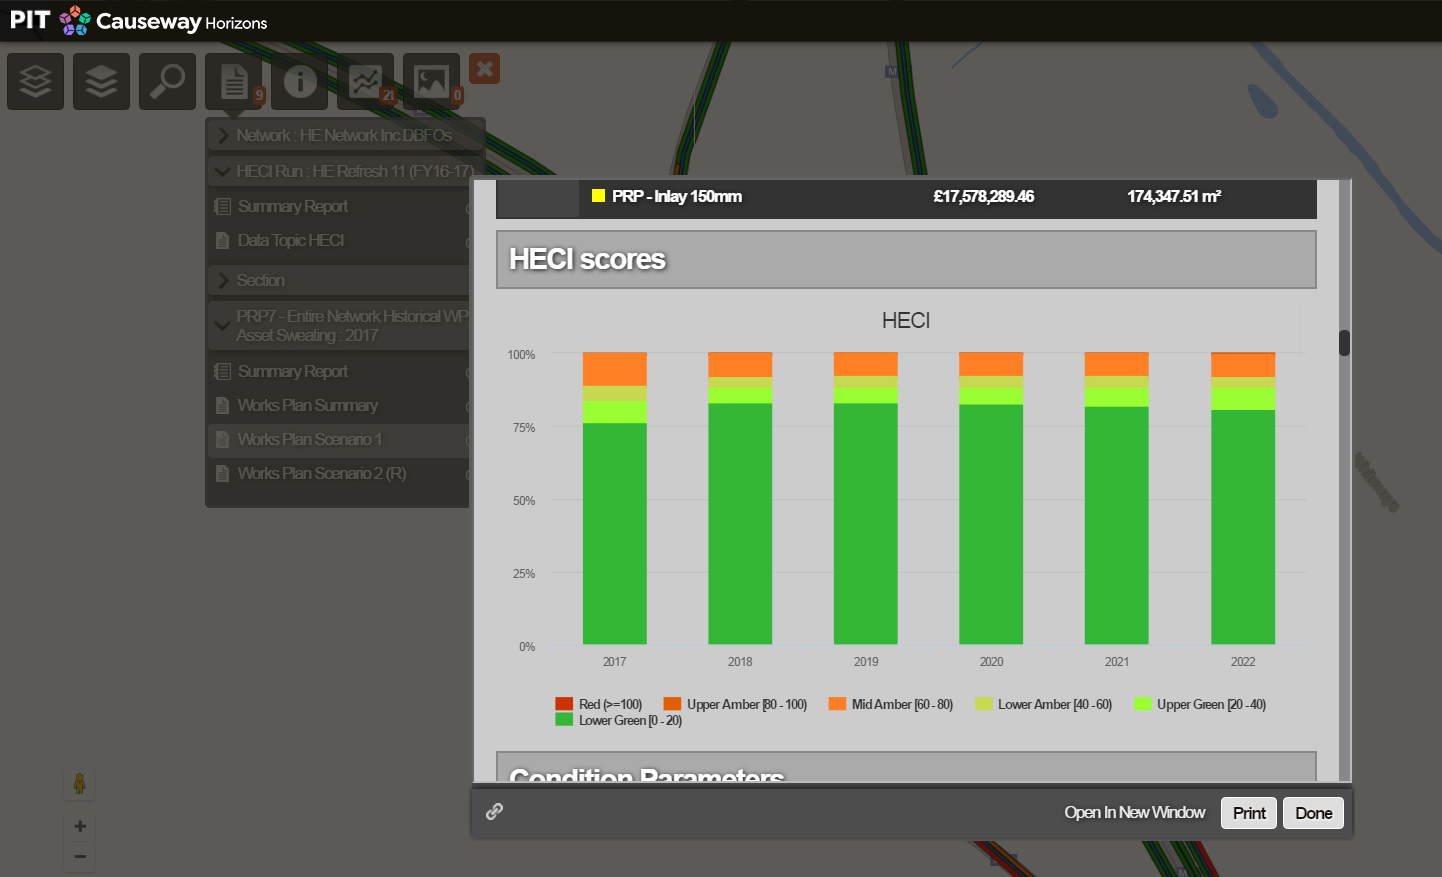
To view HECI scores as a monitor
- In Explorer, select the Works Plan Layer containing the HECI data.
- Click the Reports icon. The list of Layers to report on drops down.
- Select the required Works Plan report from the folder.
- Scroll down to locate the HECI scores monitor.