Viewing a Summary Report
Summary reports are interactive charts that are displayed onscreen in Explorer. Summary reports can be mapped to Networks, sub-Networks or sections of Network to show detail at different levels of granularity. A summary report will show information for the selected Network, sub-Network or section by default. To change the scope of the summary reports, select the desired portion of your Network.
To view a summary report
- Select the Layer required for the report
- Click the Reports icon.
The list of Layers to report on drops down. Summary reports are identified in the list with the following icon:
![]()
- Select the required report from the report folder.
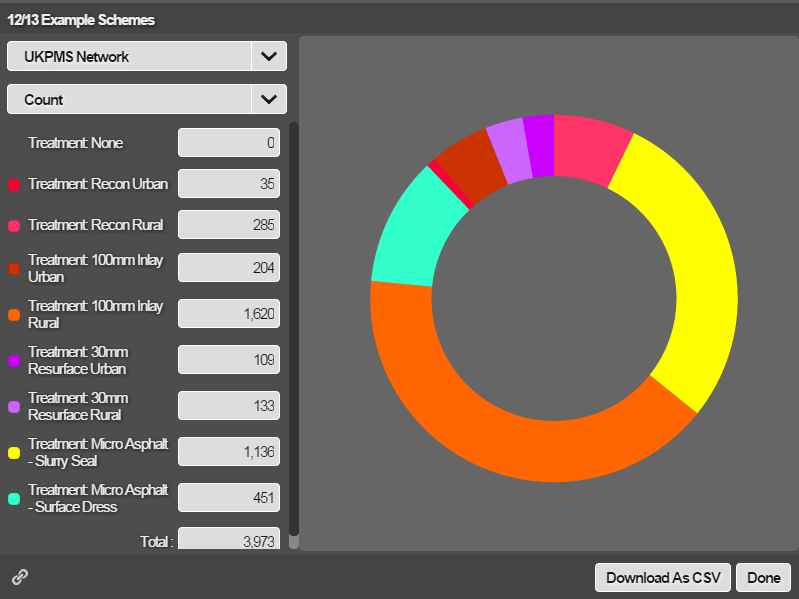
Example Summary Report
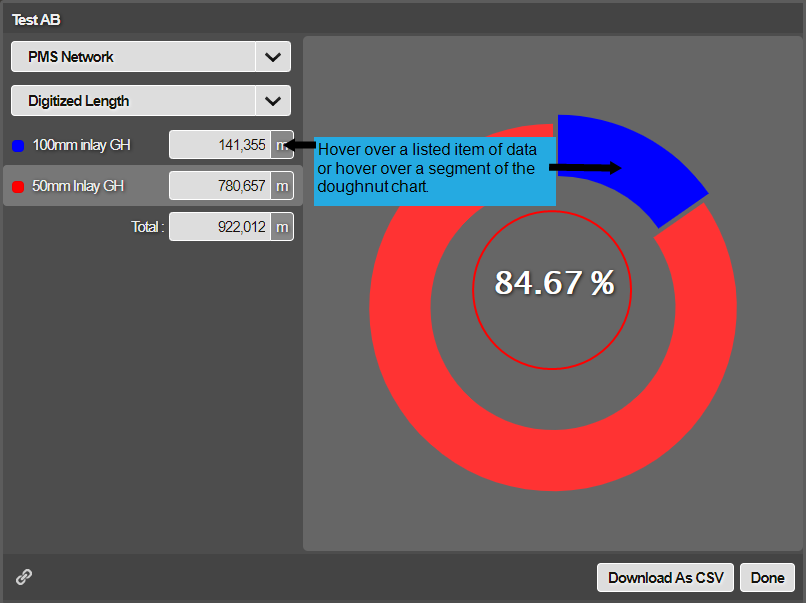
You can interact with the summary report in the following ways:
- Change the reference Network referred to by summary
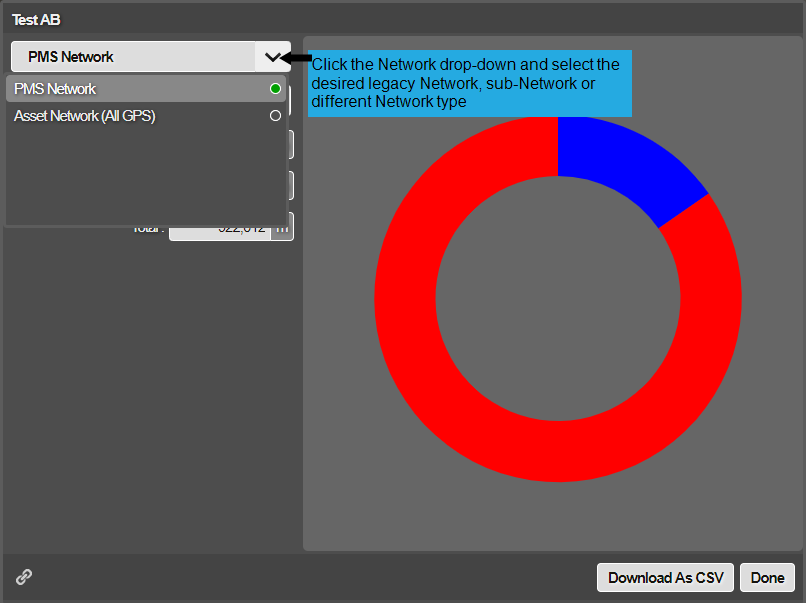
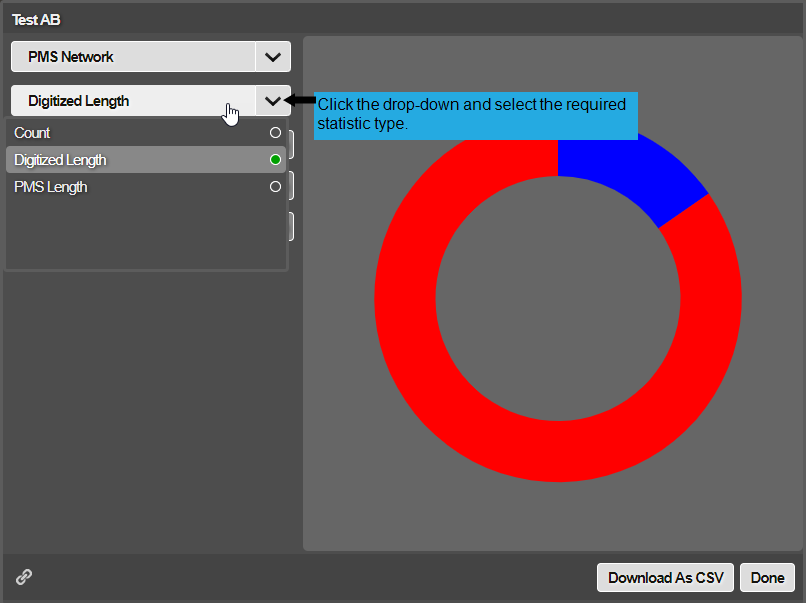
- Change the type of statistics in the summary
- To highlight a segment of the doughnut pie chart
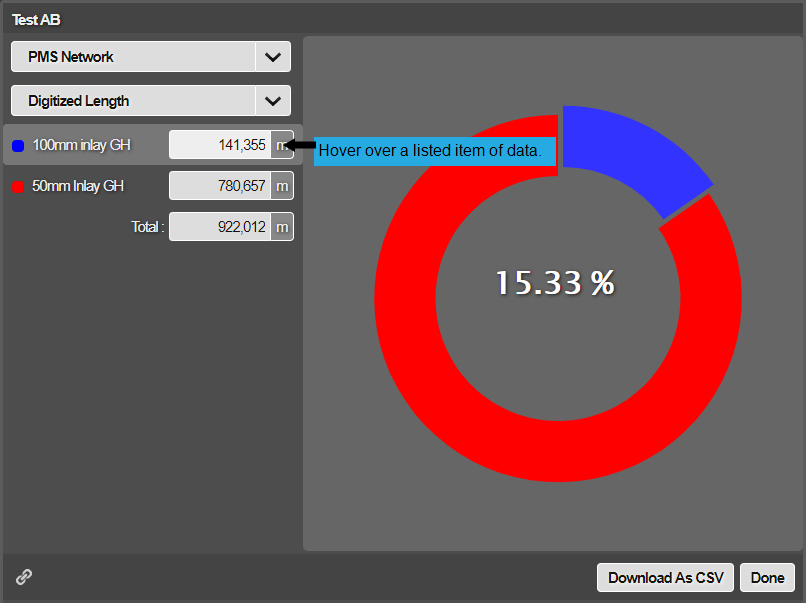
- To highlight a listed item of data
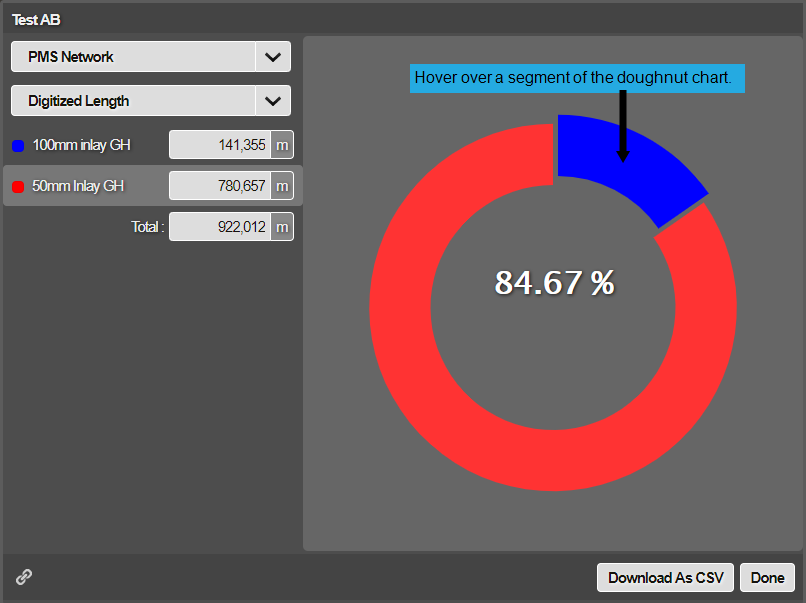
- To view the percentage proportion of the selected item of data
Summary statistics vary depending on the type of spatial Layer that you select.
- Points: Count
- Lines: Count, Digitised length (m), PMS length (m)
- Polygons: Area (m2), Count, Digitised length (perimeter) (m), PMS length (m)
Networks can contain both digitised lengths and PMS lengths.
Digitized length relates to the spatial length of the line or polygon within the two-dimensional mapping.
PMS length is the chainage length of the item as used in PMS systems. This is the PMS end-chainage minus start-chainage for the item ranging from 0 to the PMS Length of the Section (i.e. the PMS Measured Length entered for the Section).
Normally the difference between the two is minor. For example, if a linear item such as a safety fence extends along the entire length of the Section, the digitised length might be 100m, but the subsection length (which is related to the PMS measured length of the Section) may be 110m.