About the Historical Data Deterioration Curve
Horizons calculates predictive models directly from historical data for each Condition Parameter required by the user, such as rutting and fretting. These predictive models are deterministic; evolution over time can be calculated from a minimum of 2 years data. More historical data increases the accuracy of the models.
A deterioration curve that is derived from historical data is calculated by first dividing the user defined range of permissible values for a Condition Parameter into a number of bins where each bin represents a small parameter range. The mean rate of deterioration is determined for each bin over all subsection lengths within each homogeneous group. For each subsection length the year-on-year condition change is used to calculate a deterioration rate for a range of deterioration values.
For example, let condition x represent rutting on a single subsection that deteriorates from 2.3mm at time tN to 3.0mm at time tN+1 the following year. The rate of deterioration during that period can be calculated as:
Rate of Deterioration
(δx/δt) = (xN+1 - xN) / (tN+1 – tN)
(δx/δt) = (3.0 – 2.3) / 1
(δx/δt) = 0.7mm per year
This deterioration model is then used to update the mean values for bins within the range of 2.3mm to 3.0mm of rutting as shown in A below.
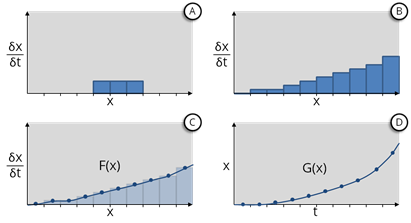
By repeating this process and taking the statistical mean for all subsection lengths, we construct a histogram that describes the mean rate of deterioration for each bin value (see B above). This produces the curve shown in D.