Components Used to Calculate the HECI
PIT combines asset groups, condition families, and thresholds to formulate the HECI. The following describes each component in more detail, and gives an explanation of how condition families are weighted in the calculation.
Asset Groups
Horizons first divides your network into the following asset groups:
- Motorways (M)
- Rural Duals (RD)
- Urban Duals (UD)
- Rural Single (RS)
- Urban Single (US)
Slip roads are classified to match their corresponding major road. Roundabouts and lay-bys are not included.
Condition Families
Survey condition parameters are divided into the following three condition families:
- Longitudinal Profile Variance
- 3m Max Enhance (LL03)
- 10m Max Enhance (LL10)
- Texture
- Fretting (LFRT)
- Texture Low (LLTX)
- Texture High (LLTX)
- Rutting
- Left Rut (LLRT)
- Right Rut (LRRT)
Thresholds
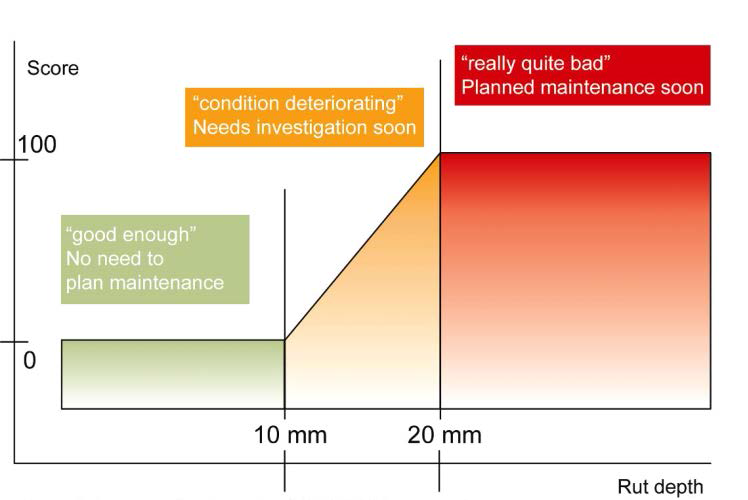
Horizons measures parameters against a pre-configured rating curve to output a score from 0 to 100, as in the example below:
Horizons uses thresholds to produce the representative output are as follows:
| Condition Family | Road Class | Lower Threshold (below which the score is 0) | Upper Threshold (above which the score is 100) | Scoring Equation |
|---|---|---|---|---|
| 3m LPV Enhanced | All | 2.2 sq mm | 3.8 sq mm | SL3= (62.5 x 3m LPV) – 137.5 |
| 10m LPV Enhanced | Motorways and Rural Dual Carriageway | 6.5 sq mm | 22.8 sq mm | SL10 = (12.195 x 10m LPV) – 79.268 |
| Urban Dual Carriageways and Rural Single Carriageways | 8.6 sq mm | 22.8 sq mm | SL10 = (7.0423 x 10m LPV) – 60.563 | |
| Urban Single Carriageways | 18.3 sq mm | 36.8 sq mm | SL10 = (5.4054 x 10m LPV) – 98.919 | |
| Fretting | All | 5 | 10 | SF = (20 x Lane Fretting) – 100 |
| Texture Low | All | 0.8mm | 0.4mm | STL = (250 x Texture Depth) – 100 |
| Texture High | All | 1.8mm | 2.2mm | STH = (250 x Texture Depth) – 450 |
| Rutting Left | All | 8mm | 18mm | SRL = (10 x Rut depth) – 80 |
| Rutting Right | All | 8mm | 18mm | SRR = (10 x Rut depth) – 80 |
Condition Family Weighting
Horizons calculates the final HECI score through a weighted sum of the maximum score of each condition family based on the following weighting:
- Longitudinal Profile Variance WL = 0.8
- Texture WT = 0.6
- Rutting WR = 1.0