Reports and Charts
Horizons provides several ways to view reports and charts about the information it contains. You can view a report within Explorer or export it for use in another software tool. Reports and charts are all accessed through the Reports icon.
![]()
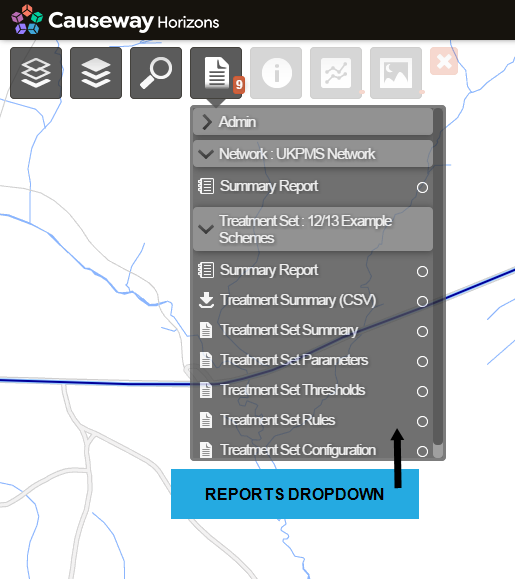
Each data Layer in Horizons is linked to one or more reports. When a data Layer is selected, the Reports icon (shown below) is updated to include the report(s) for the Layer. The number on the Reports icon indicates the number of reports currently available based on the selected Layers.
For each Layer that is turned on, the reports that relate to the data in the Layer are organised under a single report folder with the same name as the Layer.
The Reports drop-down contains reports at both summary and detailed levels as well as exports so that the information can be used outside of Horizons. Any Comma Separated Value (CSV) reports that are available for download are presented in the drop-down list.
If you have network filtering enabled, you can view detailed reports about a select sub-Network. See About Network Filtering.
Access to Reporting may be limited by licence or Administrator designation. See Setting User Permissions.
Reports types are identified in the list of reports with the following icons:
Chart Icon
![]()
Indicates an interactive summary report, which displays on screen as a chart. You can download the data as a CSV file.
Detail Report Icon
![]()
Indicates a detailed report, which displays as a table in a pop-out window. You can print the report or open it in a new window.
Report Download Icon
![]()
Reports that you can download rather than open in Horizons.
The following reports are available within Horizons.
Any data or Network Layer
| Report | Description |
|---|---|
| Summary Report | Interactive report. You can change the information type for the summary using the drop-down |
Section
| Report | Description |
|---|---|
| Section Summary | When a Section is selected, the Section Report provides full details of the Section. |
| Treatment Set (Section Details) | When a Section and a Treatment Set Layer is selected, the Section Treatment Set Report provides the details of the Treatments that are identified for the Section. Use this to verify analysis output. |
| Works Plan (Section Details) | When a Section and a Works Plan is selected, the Section Works Plan Report provides the details of the proposed works that are identified for the Section. Use this to verify analysis output. |
| Works Plan (Section Details) | When a Section and a Works Plan is selected, the Section Works Plan Report provides the details of the proposed works that are identified for the Section. Use this to verify analysis output. |
Section Item
| Report | Description |
|---|---|
| Section Item Summary | When a Section Item is selected, the Section Item Report provides full details of the Section Item. |
| Scheme Analysis Report | When a Section Item that describes a scheme (eg. Works Plan, Treatment Set, or imported scheme) is selected, the Scheme Analysis Report compares the scheme's condition parameters against the rest of the network. |
Treatment Set Layer
| Report | Description |
|---|---|
| Treatment Summary (CSV) | CSV report of all Sections with treatment quantities for current financial year. By default this will be referenced against the most recent version of your Network. |
| Treatment Set Summary | Report detailing input parameters for the selected Treatment Set, including cost and quantity for each Treatment in the Set. |
| Treatment Set Thresholds | Report listing the thresholds for each condition parameter used in the Treatment Set setup. |
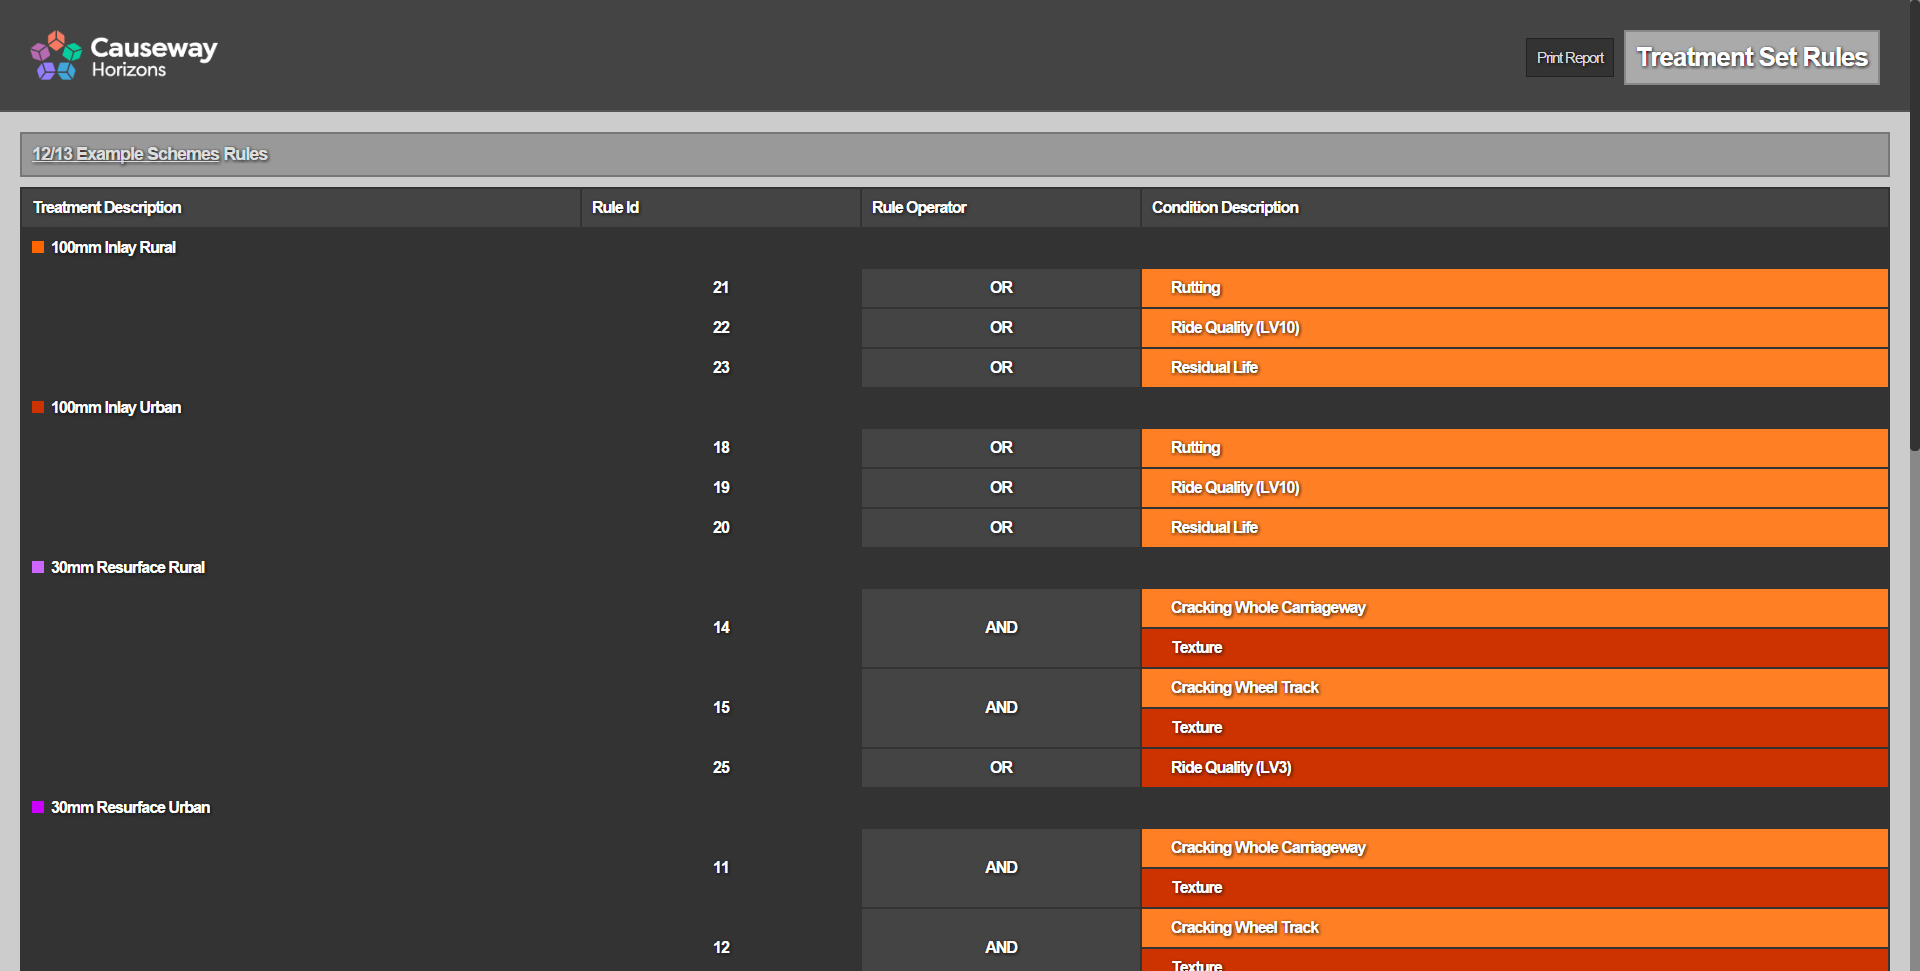
| Treatment Set Rules | Report listing rules for each of treatments added to the Treatment Set setup. |
| Treatment Set Configuration | Report with details on the treatments used within the Treatment Set. |
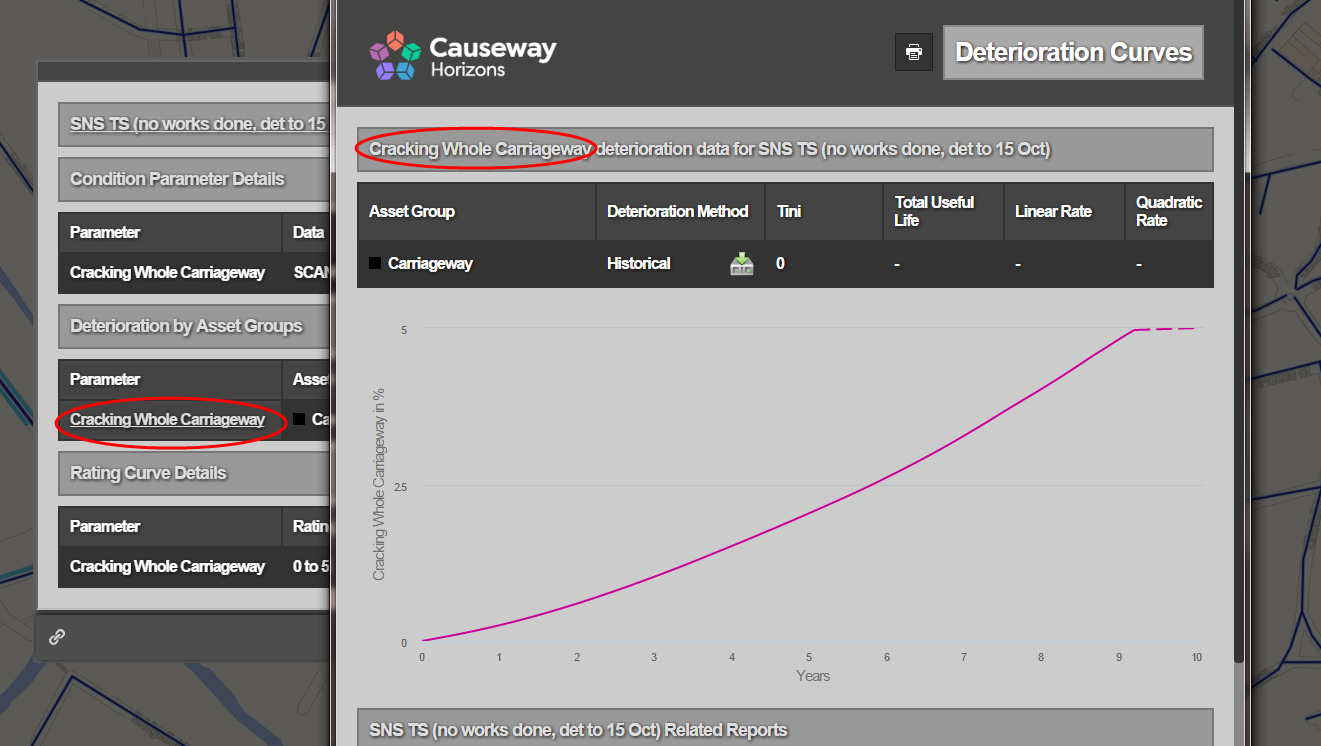
| Treatment Set Parameters | Report with details about all condition parameters analysed in the Treatment Set. Provides access to *Deterioration Curves* Sub-Report. |
| Deterioration Curves | Linked Sub-Report with parameter deterioration curves for analysed asset groups, as they were at the time the Treatment Set was run. Can only be accessed by link from Parameters Table in Treatment Set Parameters Report. |
| Treatments for XSP and year | Linked Sub-Report with information about section deterioration and treatments decisions. Can only be accessed by XSP link within the *Treatment Set Section Summary Report*. |
Works Plan Year Layer
| Report | Description |
|---|---|
| Treatment Summary (CSV) | CSV report of all Sections with treatment quantities broken down by financial year. |
| Works Plan Summary | Report describing Works Plan input parameters and comparison of results between scenarios. Report includes Works Plan monitors and strategies and contains link to Works Plan Sub-Report. |
| Works Plan Scenario | Detailed Works Plan scenarios report, including treatment types and cost by year. By default this will be referenced against the most recent version of your Network. In the Reports dropdown, an (R) displays beside the recommended scenario. |
| Works Plan Monitor | Linked Sub-Report covering the value of Works Plan monitors per Financial Year and scenario. Can only be accessed by link from *Monitors Table* within *Works Plan Summary Report*. |
| Treatments for XSP and year | Linked Sub-Report with information about section deterioration and treatments decisions. Can only be accessed by financial year link in *Works Plan Section Summary Report*. |
UKPMS Report Layer
| Report | Description |
|---|---|
| Data Topic 130-01 | Report with Performance Indicator (PI) values for England A roads. |
| Data Topic 130-02 | Report with Performance Indicator (PI) values for England B & C roads. |
| FNS Condition Summary | UKPMS Footway Network Survey summary with condition levels breakdown. |
| BVPI 187 | Best Value Performance Indicator Report for Condition of Footways. |
| BVPI 224b | Best Value Performance Indicator Report for Condition of Non-Principal Unclassified Roads. |
| Unclassified Visual Survey | Best Value Performance Indicator Report for condition of unclassified roads based on the latest of CVI or DVI data. |
| HAMFIG Carriageway Inventory | Report detailing carriageway inventory data and SCANNER, CVI, and DVI condition data. |
| SRMCS | Scottish Roads Maintenance Condition Survey Report, including Scottish Performance Indicator (PI) report for A, B C and U roads. |
| THS/012 | Welsh Performance Indicator (PI) report for A, B and C roads. |
| Unclassified SCANNER | SCANNER survey report for unclassified roads. |
| HECI | Report gives condition scores over the network classified into green, amber, and red bands. |
Deep Linking Reports
![]()
You can copy and share a link to reports using the icon at the bottom of any report. To view linked reports users will need to be logged into Horizons with the product licences required to view the shared report.
Summary Reports
Summary reports provide an easy way to view the high level statistics of a Layer. For instance, the summary report for an asset type such as reference markers instantly indicates the number of markers in the dataset (and therefore the Network). Similarly, a summary report for a Layer of proposed treatments over the Network displays the number and length of the treatments over the Network.
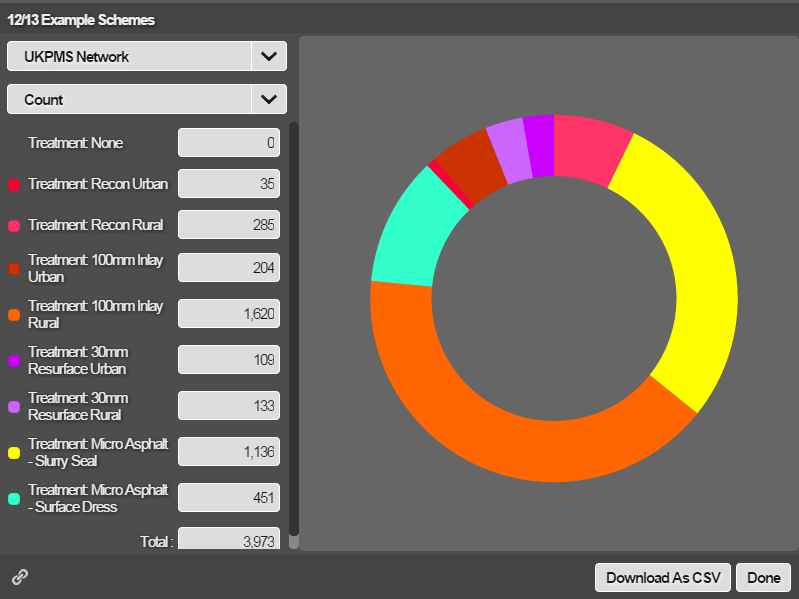
Summary reports are interactive. You can change the type of statistics that you see in the summary. Hovering over a listed item of data highlights the corresponding segment of the doughnut chart, and vice versa. The percentage proportion of the selected item of data is displayed in the centre of the doughnut chart.
Detailed Reports
Detailed online reports are available in the Reports drop-down. These reports are designed to deliver specific information regarding a selected data Layer, Section, or Section item.
Linked Sub-Reports
Linked Sub-Reports are available only by link from another report. When you view a detailed report you can click on underlined text to open new reports, including Linked Sub-Reports.
Administrator Only Reports
Horizons provides additional reports that can only be accessed by administrators.