Predicting Future Conditions
Analysis begins by re-sampling the surveyed condition data into fixed length subsections. The subsection lengths can be set by the user but by default will be set to either 20m or 100m to balance the resolution of national surveys against the efficiency of processing the data. By separating subsections into these fixed lengths, Horizons is better able to align the results with different survey condition data.
Horizons can predict the future condition of the Network per subsection length by extrapolating from historic data or through a user-defined curve.
The forward prediction is based on two variables:
- the last known condition and the deterioration model. The last known condition is obtained from the most recent survey available for each subsection length. Horizons calculates the deterioration model using the historic survey data to produce a deterioration curve.
- Horizons can also perform the calculation using a deterioration curve that you set up yourself. A non-historical deterioration curve can be either linear, quadratic, useful life, or you can produce a fully customized one by defining each point of the curve.
Asset Groups and Condition Parameters
Deterioration models for each Condition Parameter are defined per asset group as Condition Parameters in the Analysis module.
The Network is divided into asset groups where lengths within each asset group are identified as behaving and deteriorating homogeneously. These homogeneous groups are classified using user defined characteristics such as material type, XSP, construction type as well as traffic loads. Condition data within each homogeneous group is then used to build a deterioration model for each pavement Condition Parameter. The timing of maintenance of all assets within any homogeneous group will differ, therefore, it is assumed that each group contains many Network lengths each exhibiting a varied level of deterioration. This is used to calculate a mean deterioration curve for each parameter where it simply describes the changing value of condition over time.
How a Deterioration Curve Calculates Future Condition
Future condition can be calculated directly from a historical (or other) deterioration curve for a Condition Parameter. Using a deterioration curve for forward prediction allows the future condition of each subsection to be individually projected based on the last known condition value.
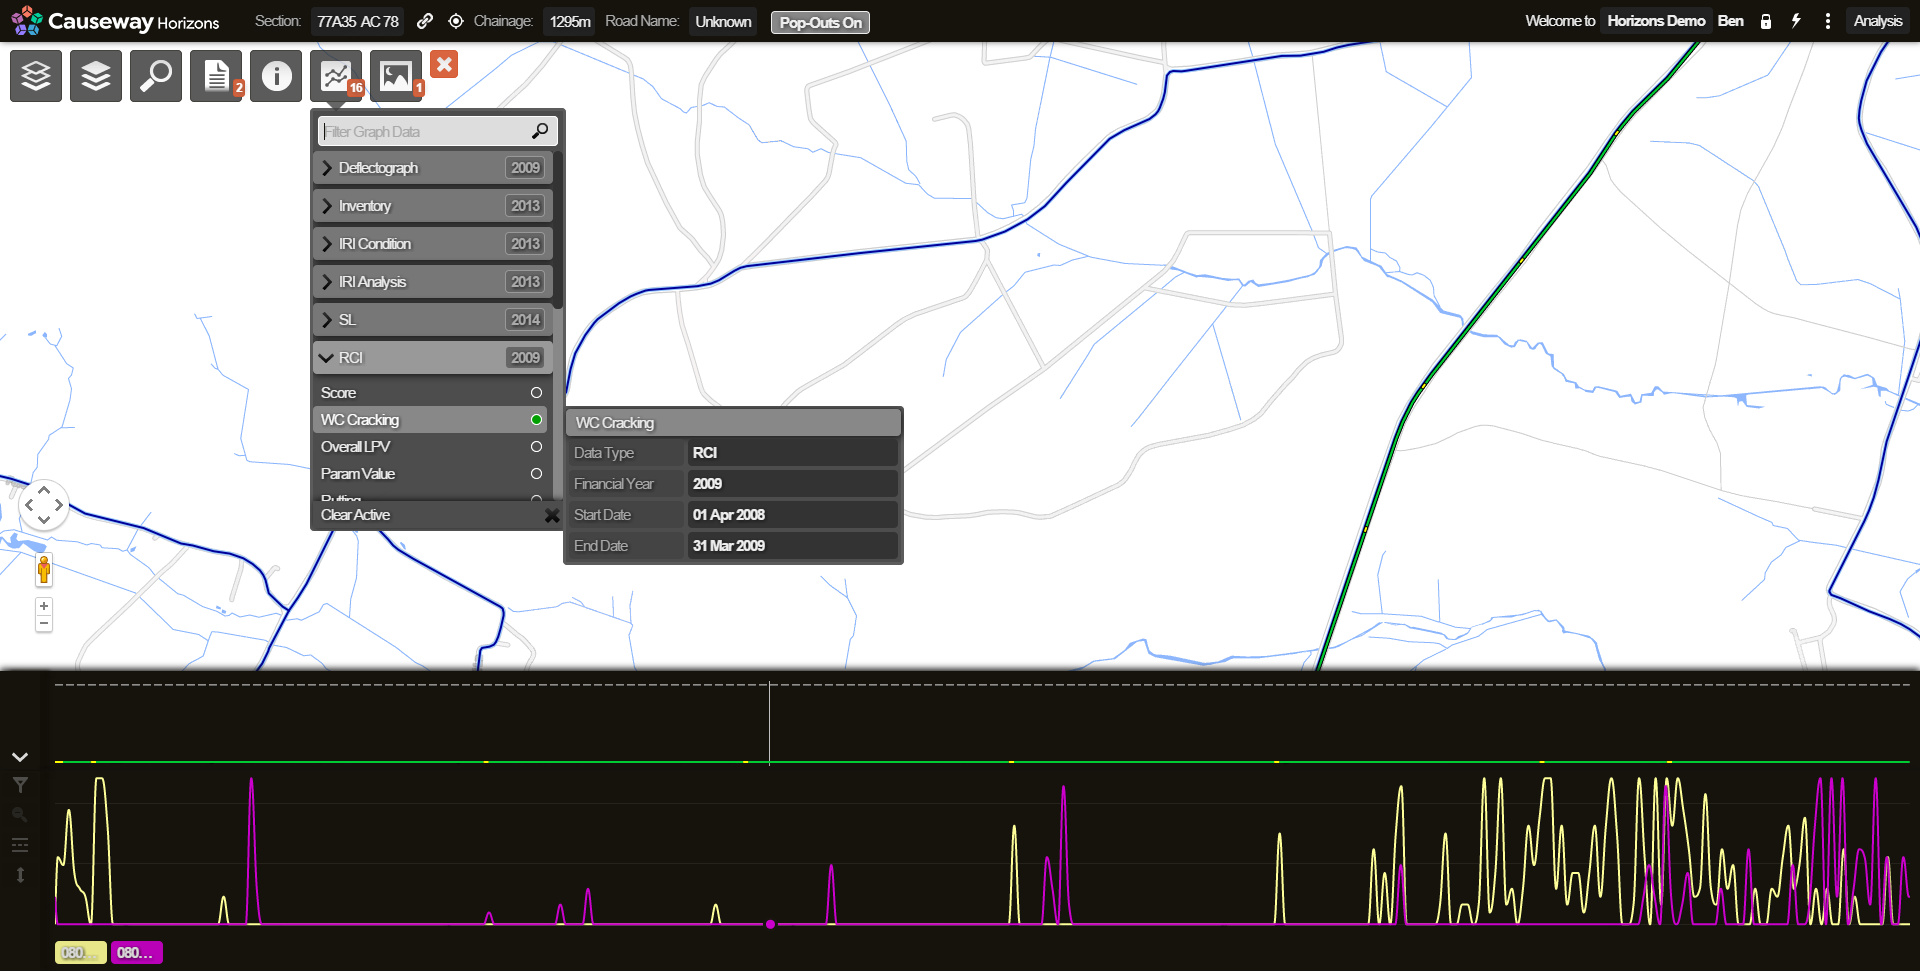
In the following diagram:
- xt is the current condition
- t is the time the subsection has taken to get to this condition (i.e. to now)
- T is a time in the future
- xt+T is the condition at this future time
Step A is to locate the current condition (xt) on the curve, which also identifies the time taken to reach that condition (t).
Step B is to calculate the time (T) in the future by moving the required amount along the time line beyond time t.
Step C calculates the corresponding future condition (xt+T) by referring to the condition value at time T.
So, by projecting along the curve, the future condition is determined.
Viewing Predicted Future Condition by Year
The future condition values for each Condition Parameter can be predicted using the deterioration model, assuming that no intervention takes place.
Future condition values are available to view as Layers.
If you like future conditions to be visible as Layers, contact the support team.
For more details of how to view Layers and Graphs, see Viewing Data and Viewing a Graph.
To view future Condition Parameters on the map
- In the Explorer module, click the Layers icon to open the Layers drop-down.
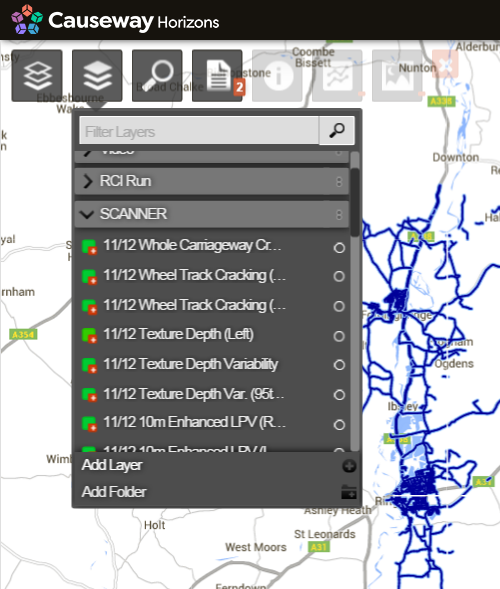
Each Condition Parameter has a folder. Each Condition Parameter folder contains a single Layer for each year.
- Click the Layer for the year of interest.
The data is visible on the map.
To view future Condition Parameters for a Section in the graphing panel
- In the Explorer module, navigate to the required Section at interaction level, and click to select it.
- Click the Graphing icon to open the Graphing drop-down. Predicted future condition values are available as graphable data organised by year.
- Click the Layer for the year of interest. The data is visible in the graphing panel.