Defining a Deterioration Curve
Each Condition Parameter can be set to deteriorate using a deterioration model that you define. The available models are historical, linear, quadratic, useful life, and custom. The historical model uses past survey data to estimate the deterioration curve for the parameter following the onset of deterioration (Tini). The linear, quadratic, useful life, and custom deterioration models allow you to specify how the parameter is expected to deteriorate annually.
To define a deterioration curve for an asset group use the following procedure:
- In the Analysis module, click the Parameters icon.
The Parameters drop-down opens. All condition data for your Network is divided by survey type into folders.
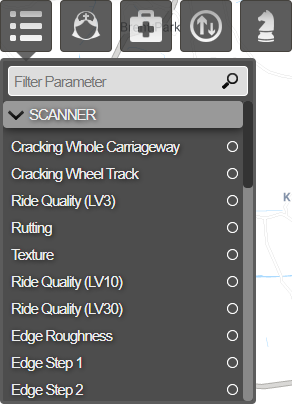
- Select the parameter you want to use, this allows you to view and configure the deterioration curve in the Parameter Editor.
- Locate the asset group from the Asset Groups box. Depending on the parameter you selected you may need to scroll within the box. Click the gear icon to the right of the asset group name.
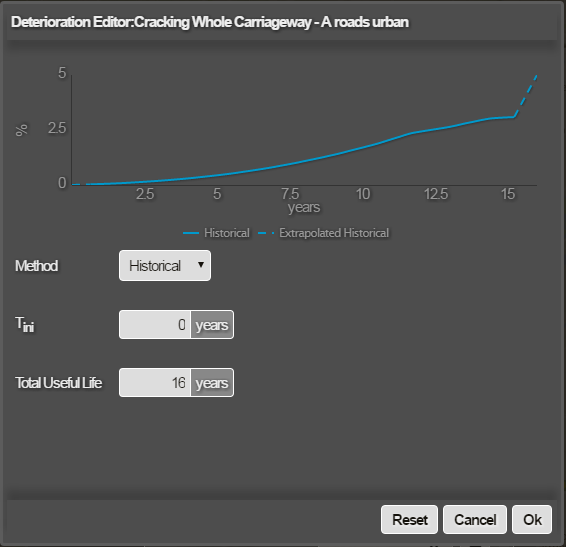
The Deterioration Editor is displayed. The blue line is the historical deterioration curve that is computed statistically from all the data held within Horizons for the selected Asset Group. If you are defining your own deterioration curve by whichever other method, the historical curve is there to provide a measure against which to model the curve to your requirements.
The Y axis is defined by the parameter range defined in Parameter editor.

- Edit the deterioration curve as follows:
| Setting | Description |
|---|---|
| Tini | Set the amount of time in years before the onset of any deterioration. |
| Total Useful Life | Set the amount of time in years for the useful life of the asset. |
| Bound Type | This field allows you to select from a drop down list the type of method you want to use to define the deterioration curve. |
| Bound Value | Set the amount of time in years for the useful life of the asset. |
| Method | Set the amount of time in years for the useful life of the asset. |
This allows you to choose the bound type that the system uses to define the bounds limits.
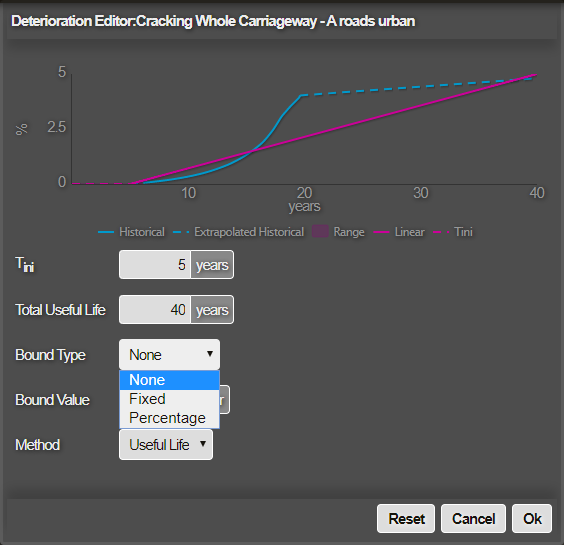
None
Setting the Bound Type to None means that this parameter will not appear in the Condition Parameters list when you create a deterioration bounds layer.
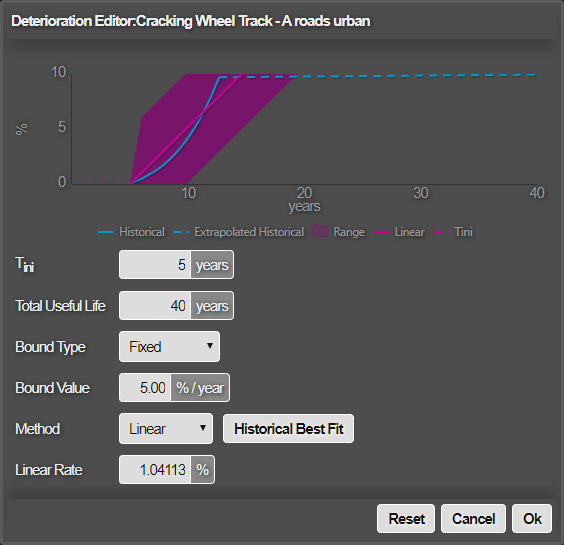
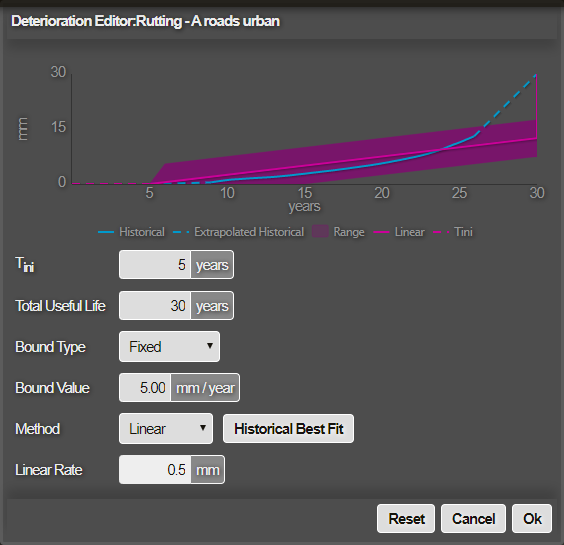
Linear
Define a rate per year for a linear deterioration. The Historical Best Fit button will auto-populate with figures extrapolated from historical data and automatically calculate the Linear Rate.
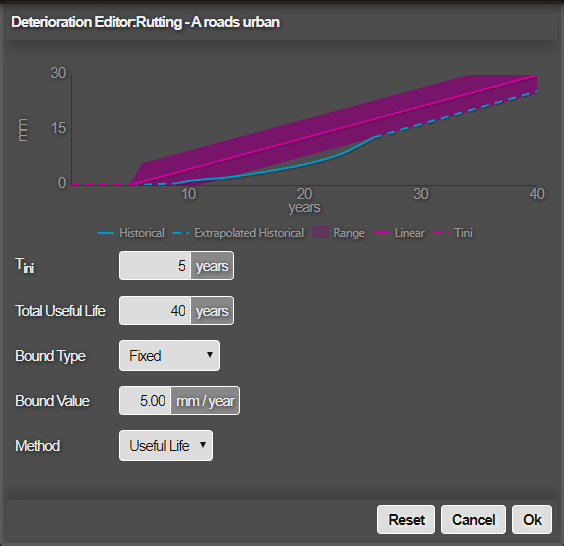
Example of Linear rate being too low
If the defined deterioration curve does not reach the maximum parameter range value, then Horizons deteriorates the data to the top of the curve automatically by the end of the Total Useful Life, which can produce an unusual step at the end of the graph as illustrated below.
In this example the Linear Rate for rutting was set to 0.5mm per year and the total useful life is only 30 yrs but, the maximum parameter value for rutting is defined as being 30mm. The final calculated deterioration points at 15mm in year 30, however, the defined curve will jump to 30mm after it reaches 15mm, as it needs to reach the end of the parameter range by the end of the total useful life. So if you set a very low rate of deterioration, Horizons will always need to deteriorate the data to get to the maximum value for that parameter range by the end of its total useful life, this can cause unexpected deterioration of data where the data is outside of the curve specified and therefore it then jumps to the maximum value for that parameter range.
Historical
The historical model uses past survey data, to estimate the deterioration curve for the parameter following the onset of deterioration (Tini).
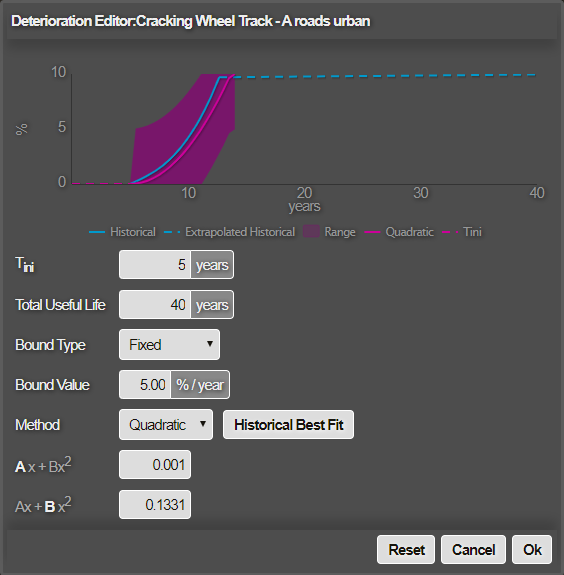
Quadratic
Define the curve according to a quadratic equation, you can enter the A and B values for the calculation or use historical data. The Historical Best Fit button will auto-populate with figures extrapolated from historical data, when available and automatically calculate the A and B values.
Total Useful Life
Total Useful life is where you simply state how long it will take until the asset has completely failed.
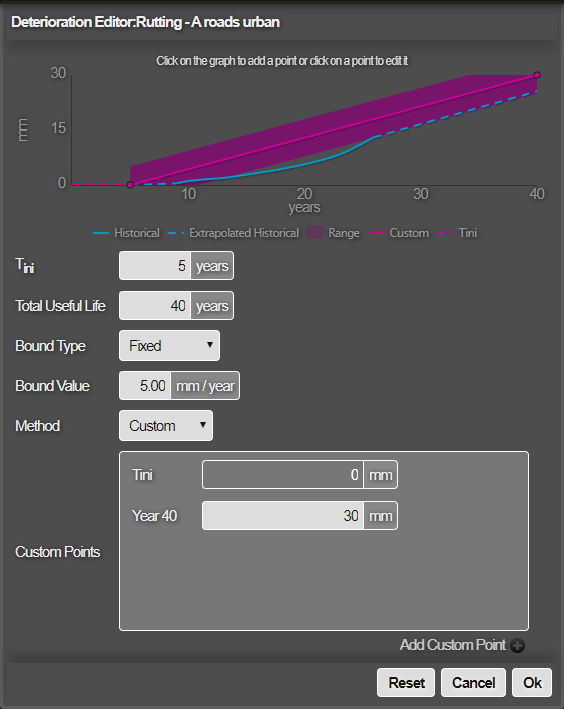
Custom
Plot a curve year by year, by clicking each year point and entering the condition data for the relevant points in time or by using the Add Custom Point option at the bottom of the menu below. You can also edit or remove points through the graph and fields available, though the first and last point cannot be deleted.
- Edit the rating curve if needed by editing the fields in the menu for your deterioration curve.
- Click Ok to save changes and close the editor.