About Layers
Networks and data are available to view on the map as Layers. Horizons can hold and present many distinct data sources as data Layers organised under the Layers drop-down.
When you select a Network, the Network is placed centrally within the map. You then select the various Layers of spatial data that you want to see overlaid on the Network map. You can see the Layer data visualised on the map.
Data Layers in the system are organised into folders. Each folder can contain multiple data Layers. You can create and modify layers.
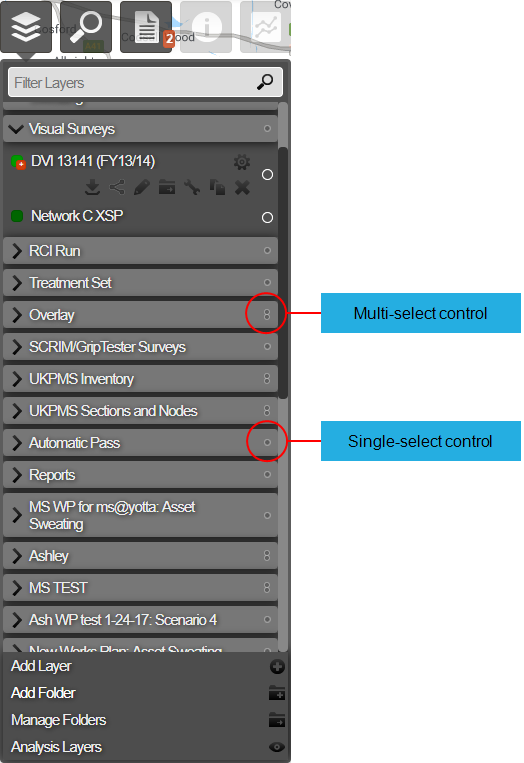
To see the Layers within a folder, click the folder name. The Layers within the folder are expanded. To close the expanded list of Layers, click on the folder name again. An arrow to the left of the folder name indicates whether the folder is expanded or collapsed.
Hover over a Layer name to see a description (legend) of the data that is provided by the Layer. If more than one Layer is active, hovering over a Layer name will isolate the selected Layer on the map.
Access to some Layer features may be limited by licence or Administrator designation. See Setting User Permissions.
The most common folders in the Layers drop-down are described as follows:
Video
This folder shows the distribution of video across the selected Network and shows the type of video that is available.
Yotta Asset
This folder displays all of the Yotta Asset Layers that are available. Select the asset Layer that you want to see on the map.
RCI-Run
This folder contains (RCI) mapping of roads based on PMS SCANNER condition data. Several mapping styles are available:
- Standard RAG mapping - Red/Amber/Green (RAG) condition data drawn against the XSPs of the Sections in your Network
- Bubble RAG mapping - a red, amber, or green circle (bubble) is displayed around each subsection. The diameter of the bubble depends on the subsection’s condition score. The larger the bubble, the worse the condition of the subsection. This is useful to get an idea of how bad a red subsection is.
- GPS RAG mapping – each RCI subsection is aligned with the exact path of the video captured by the SCANNER vehicle. The benefits of this are apparent when using the imaging module.
Visual Surveys
This folder can contain any visual condition survey data that has been collected such as standard PMS and bespoke surveys:
- DVI (Detailed Visual Inspection)
- CVI (Coarse Visual Inspection)
- FNS (Footway Network Survey)
- Bespoke visuals
Construction Data
This folder contains construction data that has been collected such as:
- Surface age
- Material type
Survey Data
This folder can contain any survey data that has been collected such as:
- TRACS (Traffic Speed Road Assessment Condition Survey, now called SCANNER)
- SCRIM (Sideway-force Coefficient Routine Investigation Machine)—measures the wet skidding resistance of a road surface
- TSD (Traffic Speed Deflectometer)—measures the structural condition of asphalt road pavements at traffic speed
- Deflectograph—a graph of deflection values of a road pavement when subject to a standard load.
Reference Points
This folder contains visual reference points such as:
- Emergency telephones
- Overbridges
- Marker posts.
Additional Data
This folder contains additional data such as:
- Accidents (AADT and AADF)
- Traffic Flow (validated STATS19).
Overlay
This folder can contain bespoke spatial Layers.
Treatment Set
The Treatment Set outputs that are created in the Analysis module are available in this folder.
PMS Sections and Nodes
This folder contains the breakdown and distribution of PMS Network information including:
- Section Class
- Footway hierarchies
PMS Inventory
This folder contains asset layers generated from PMS Inventory surveys, e.g. Carriageway and Footway surface types, widths and lengths.
Survey Summary
Each Layer shows the coverage of the various surveys held within the system.
Overlay or Custom Layers
These two folders can contain bespoke spatial Layers. For example, for data about accidents, complaints, utility works, bus routes, HGV routes etc.
Work Plans
When you create a Work Plan in the Analysis module, a new folder is generated for its output at the bottom of the Layers drop-down. This lets you review the location of the plan for each year.