The Explorer Controls
The Horizons Explorer module enables you to view your Network and Section level data in one place in a highly visual view. The mapping engine is based on Google Maps.
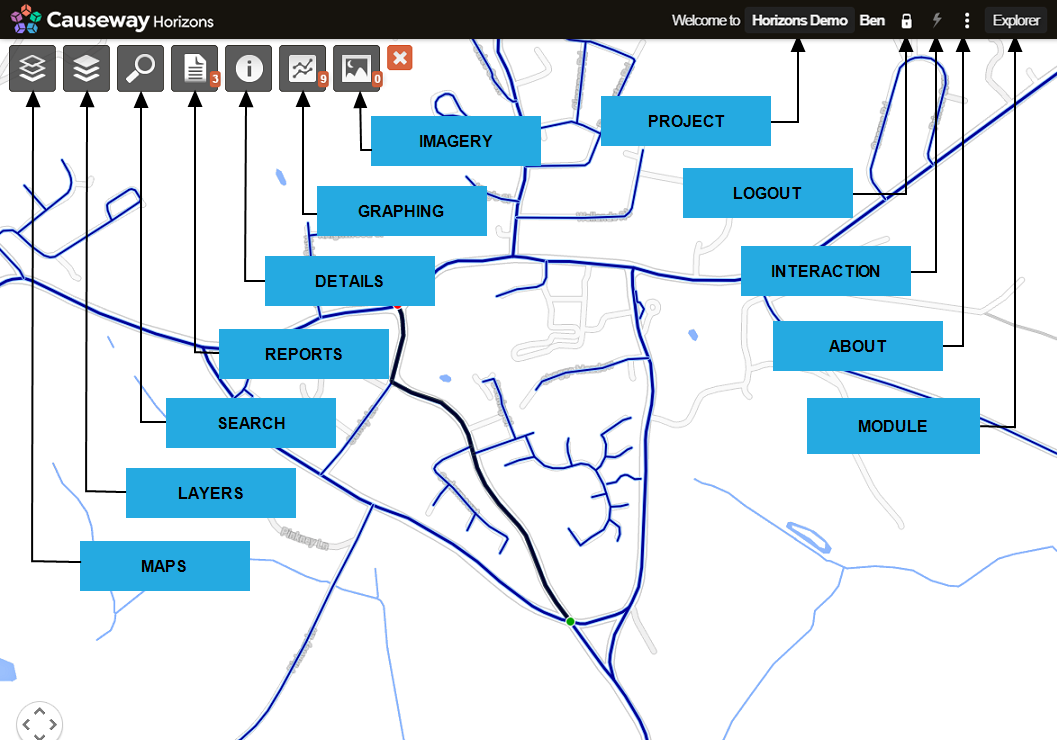
Over the mapping area are icons from which you access the Explorer functionality in drop-down menus.
Explorer functionality
Explorer Toolbar Controls
| Icon/Value | Function | Description |
|---|---|---|
| Username | Username | Displays the username associated with the login. |
| | Logout | To log out of Horizons, click the padlock icon and selcted logout |
| | Interaction |
|
| | About | Provides information about the Horizons software version. |
| Module | Module | When you log into Horizons, it opens in the Explorer module. To change module, click the module name, and select the required module. Only the modules that you have a licence for are displayed. |
| Project | Project | Clicking the project name in the top right hand corner will change project for users with access to multiple projects. |
| | Maps | Allows you to change the base map |
| | Layers |
|
| | Search |
|
| | Reports |
|
| | Information | When a Section or item on the map is selected, the **Information** icon is enabled. Click the icon to display information for the selected Section or item in a pop-out window. |
| | Graphing Data | When a Section on the map is selected, the **Graphing data** icon is enabled and shows the number of graphs available for the Section. Click a graphing item to display the graph in a panel below the map. You can then view how asset condition, for example, varies over a Section and compare multiple condition measures. |
| | Imagery Data | When a Section on the map is selected, the **Imagery data** icon is enabled and shows the number of image items that are available for the Section. Selecting an image item from the Imagery menu opens a photo/video viewer, and the map displays the location of the camera and angle of the view. |
 | Print Button | You can use this button to produce a hardcopy of the currently displayed map, including any displayed layers. |
| | Close | To deselect a Section, click the Close icon. |
| Section | Section | Shows the ID of the selected Section. |
| | Link | Shows the URL for the specific Section and data that you are viewing, so that you can share the view, as required. |
 | Coordinates | Select this icon and click any point on the map to show the coordinates at the selected location. |
| Chainage | Chainage | Shows the current distance within the length (chainage) of the Section. This updates as you move the cursor within the selected Section. |
| Road Name | Road Name | Displays name of road, when known. |