Understanding Data Graphs
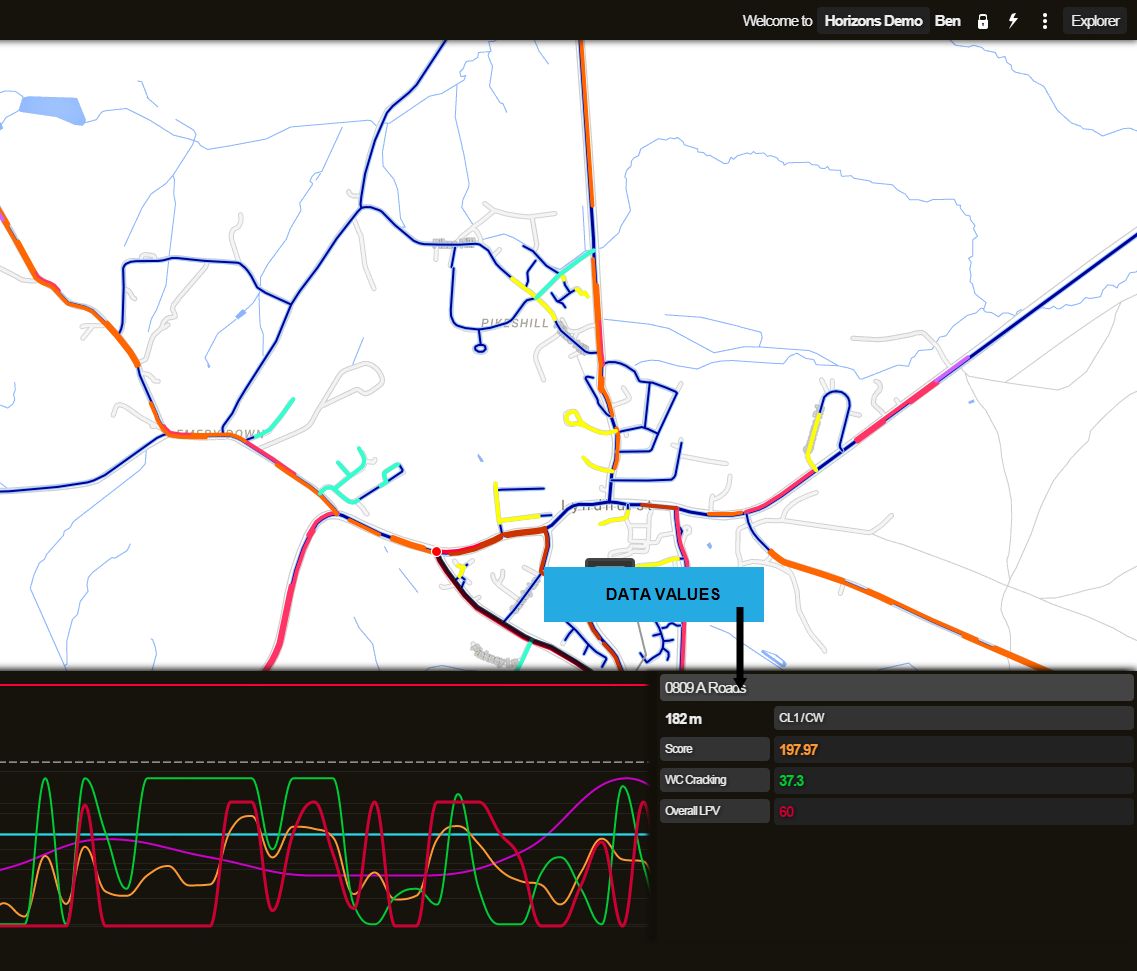
Locations in the graphing module and in the map are linked. So as you move the mouse across the graph or map, dots are displayed on the Section in the map and on the graph at the current chainage. The parameter values at this chainage are displayed in a data values table in the graphing panel. Hovering over a point in the graph also shows the parameter values at that location in the panel. Clicking on any point in the Graphing values graph will allow you to lock the Parameter display into place to allow for a detailed examination of all Parameters at that point.
When selecting a dataset from the Graphing drop-down menu, its associated XSPs (i.e. positions across the Section) are displayed in the XSP view of the graphing panel. If no data exists on a particular XSP, the XSP position is not displayed.
The XSP view shows the road lanes, carriageways, and footways as grey patterning in the background beneath the coloured lines of data. This additional visualisation helps you to correlate the XSP view with the view of the Section in the map.
As an example, you may be viewing road condition data for a Section in graph mode, and decide that you just want to see the data for the left carriageway Lane 1(CL1). You can go to the XSP view and use the Filter XSP button to turn off the right carriageway. Then when you go back to Graph view, your data is only shown for the left carriageway. Using the combination of Graph and XSP view you can filter the data visualisation to suit your needs.
Each graphed data line is accompanied by a legend button at the bottom of the panel. The legend button shows the parameter name and also the XSP for the graph line. You can use these to check the data that you are looking at. The legend buttons operate as follows:
- To display the full description of the data, hover the cursor over the legend button.
- To hide a data line from the graph temporarily, click the legend button.
- To view a hidden parameter, click on the greyed out legend button again.
To fully remove a dataset from the graphing panel, deselect that dataset from the Graphing drop-down.
The following controls are available at the left of the graphing panel:
Controls in Graph Mode
Filter by Feature Code
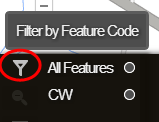
Use the filter to show or hide features from your selected data layers.
The filter remains in place if you switch to XSP mode, so you will only see the XSPs that relate to the filtered features.
(Alternatively, you can temporarily hide a data feature from the graph by clicking its legend button, or completely remove it by deselecting it from the Layers drop-down.)
Reset Zoom
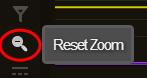
When you have zoomed into a subsection of the Section in the graph, click the Reset Zoom button to show the whole of the selected Section.
See Viewing a Graph.
Go to XSP View
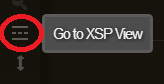
Viewing parameters in XSP mode enables visualisation of the lane in which data was captured.
Scale to fit
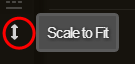
To compare condition values with the same units of measure on the same scale, enable the scale button in the graphing panel.
Pick Colours
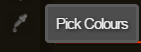
Select the colours that Parameters are graphed in.
Controls in XSP Mode
Filter by XSP
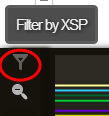
Use the filter to show or hide parameters in a specific lane.
The filter remains in place if you switch to Graph mode, so you will only see the data that relates to the filtered XSPs.
Reset Zoom
When you have zoomed into a subsection of the Section in the graph, click the Reset Zoom button to show the whole of the selected Section.
See Viewing a Graph.
Go to Graph View
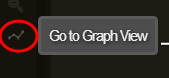
When you are in XSP mode, click this control to return to Graph mode.
Pick Colours
Select the colours that Parameters are graphed in.