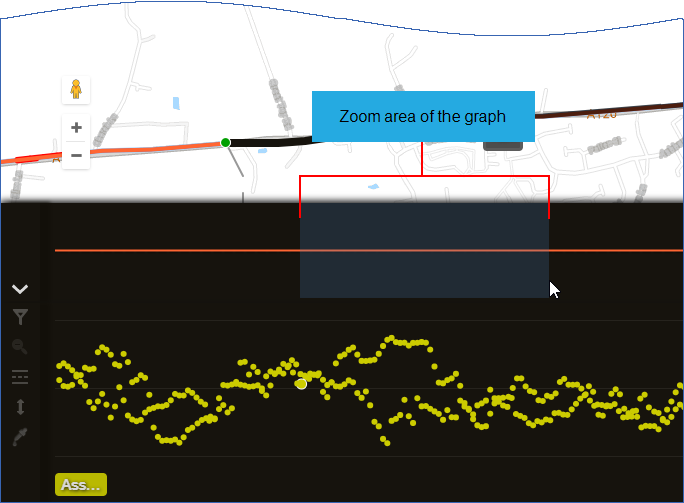
Zoom to a Subsection of a Graph
To zoom into a subsection of the graph:
- Place the cursor on the data line at the position to zoom in from.
- Click and drag the cursor along the line to the end position for the zoomed subsection.
- The zoom area is indicated by a grey highlight along the line of the graph.
The zoomed subsection adjusts to fill the graphing panel.
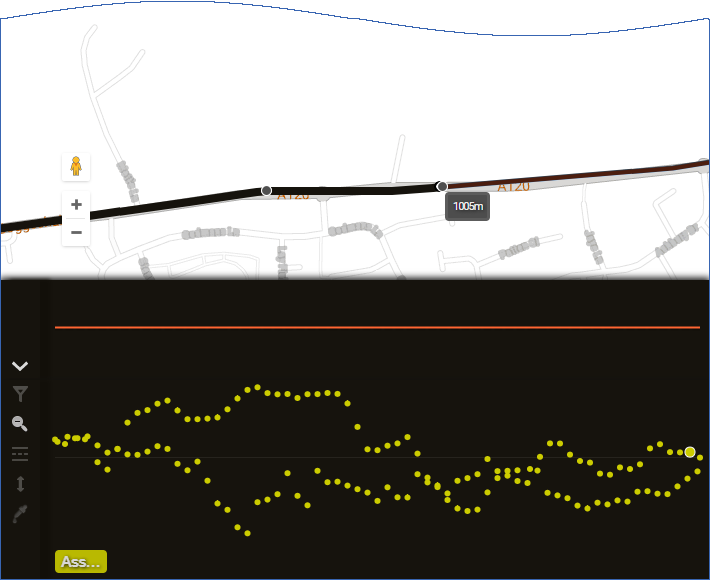
The map zooms in as well, and shows the start and end of the zoomed subsection with small circles.
For full details using the Graphing panel, see Understanding Data Graphs.