About Interaction Level
For full details on getting to Interaction level, see Getting to Network Level and Interaction Level
When at Interaction level, select the Section to interact with (see Selecting a Section). When selected, the Section is interactive.
The following then occurs:
- A green and red node show the start and end of the Section respectively. A chainage value tracks your mouse as you move it along the length of the Section.
- Any selected Layers that are associated with the Section:
- Display more information within the map (if appropriate for the type of Layer)
- Become selectable. (Where appropriate, call-outs appear to help you select data items. To select the data item, either click on the item or its call-out.)
- Section-specific icons become active
The line that denotes a Section does not represent each lane on the Section separately. To view individual lanes, turn on a Layer in which the individual lanes have data (e.g. surface material or PMS Inventory CW Layer).
The following list describes the behaviour of the data on the map in more detail.
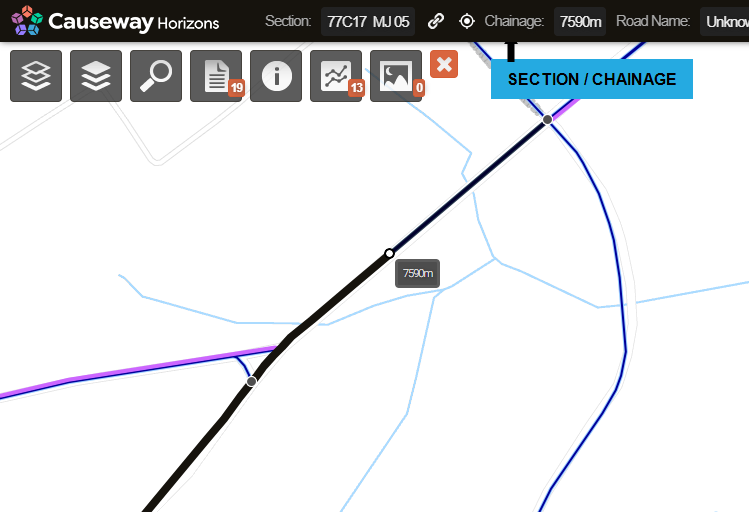
Section label and chainage displayed
As you move the mouse along an active Section, Horizons calculates the chainage and displays the approximate chainage at the mouse location in real-time. The Section label and chainage of the selected Section are also displayed in the top left hand side of the screen.
URL link to the current view of the Section
You can copy a URL link to the Section and the associated data that you are currently viewing. Then you can share the link with other users so that they can see the same view as you. Click the Link to Section icon in the top bar of the screen.
Data is active
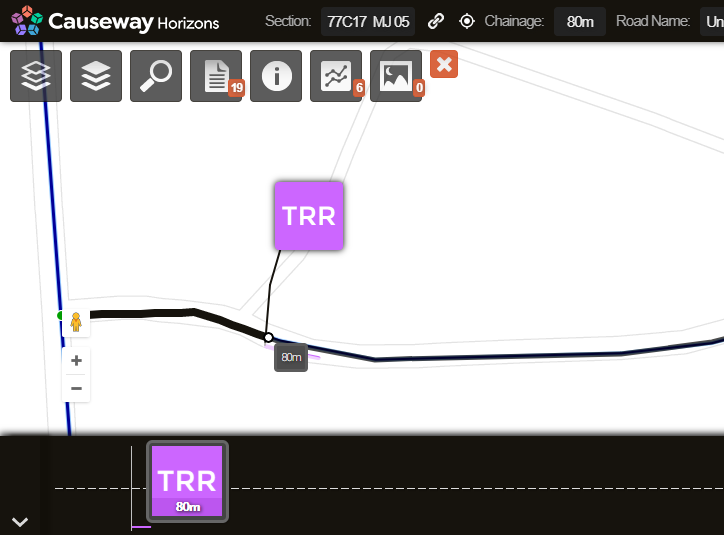
Any Layers that are currently active and have data associated with the selected Section are interactive. The data items are displayed as call-outs from the Section (as shown below). Any referenced information, from assets to proposed treatments, can be represented as data items. The call-outs are designed to make interacting with Section-level data easier. A call-out uses the same colour code as the data that it represents. Select a data item either by clicking on the item itself or on its call-out.
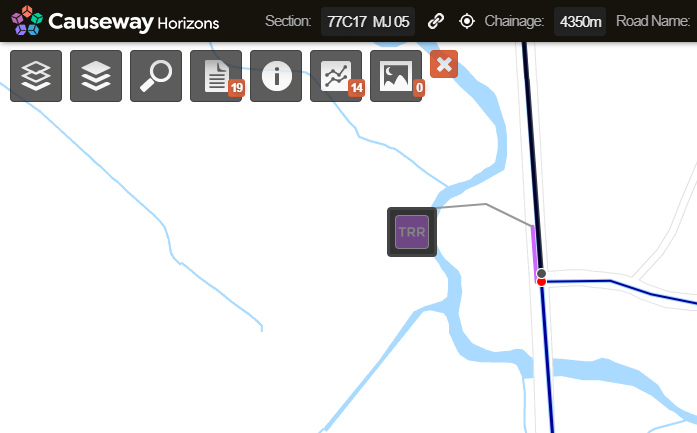
When an item is selected, it is displayed more prominently on the map and the call-out is enlarged.
For condition data sets, the data is represented in fixed length subsections (e.g 10 or 100m chunks). This results in a lot of call-outs. So the call-out feature may be more useful for point items and works plans, where fewer pieces of information are represented on each Section.
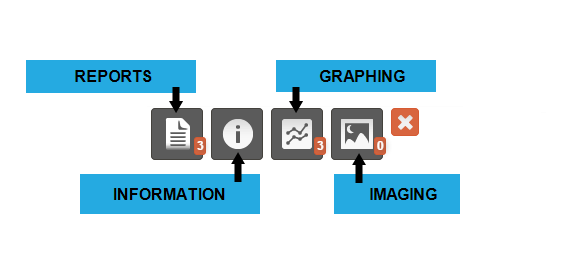
Reports for the Section
More reports may become available when a Section is selected. See About Reports
Graphing for the Section
The Graphing icon may display that there is Section-specific graph condition data to see. See Viewing a Graph
Imagery for the Section
The Imagery icon may display that there is Section-specific photography or video material to see. See Using Imagery Data
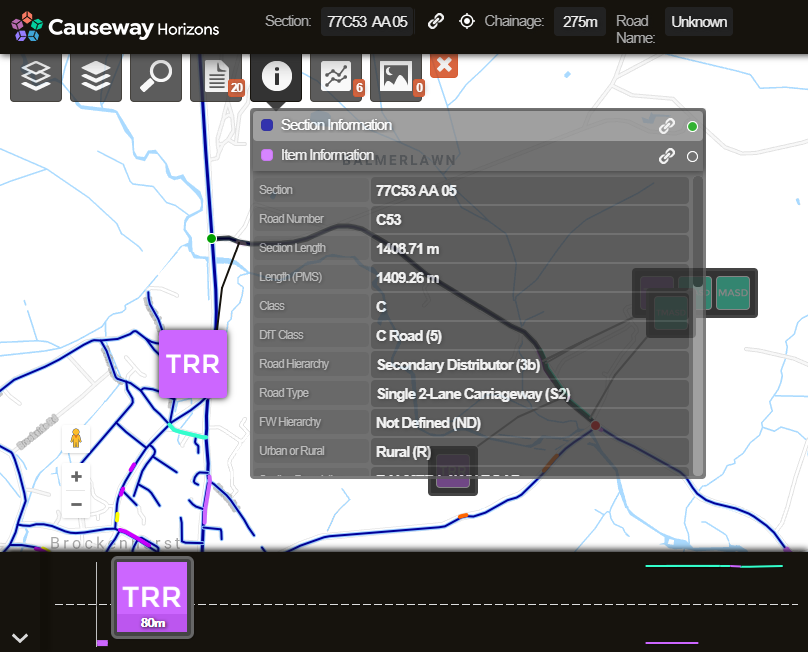
Information specific for an item
Information relating to a selected item is available under the Information icon.