Viewing a Graph
You can view data for a section in a graph view. This enables you to examine visually the condition of a road as a by plotting condition values against distance along a selected section. You can use the XSP filter to just show the condition of a single carriageway or lane (or other feature), as required.
To view a graph
- In Explorer, navigate to the Section that contains the graph data to view.
- Click the Graphing icon.
![]()
The Graphing drop-down opens to show a list of folders that contain data that can be graphed against the Section’s length.
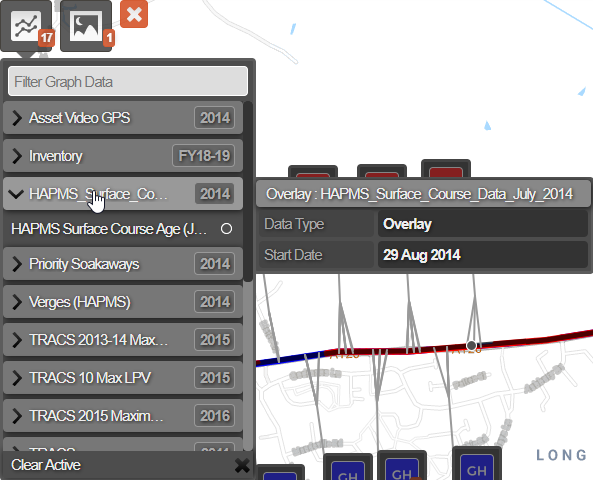
From the list of folders, click one or more parameters to view.
The graphing panel at the bottom of the screen opens. If multiple lanes of data are available, they are all displayed on the graph. You can view multiple parameters at once. These do not have to be from the same survey.
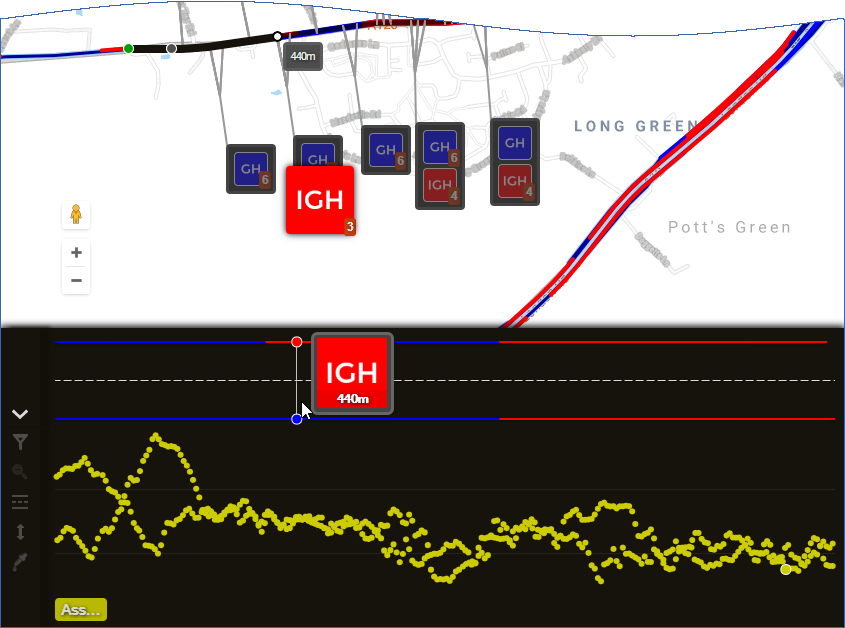
Use the available controls in the left hand side of the panel to filter the data and to zoom into a specific area of interest.