Interacting with a Section
About Interaction Level
When the map is at Interaction level, you can hover over a Section and click it begin interacting with it. This lets you view its data and select any items associated with it.
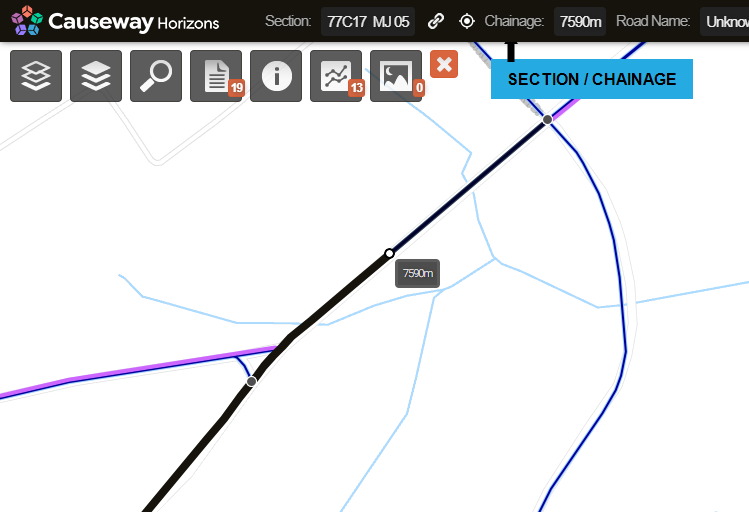
Section label and chainage
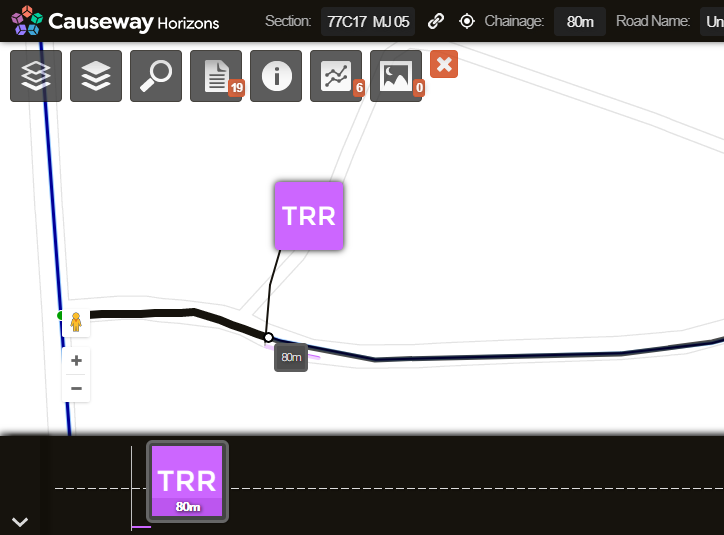
Green and red circles indicate the start and end of the active Section respectively.
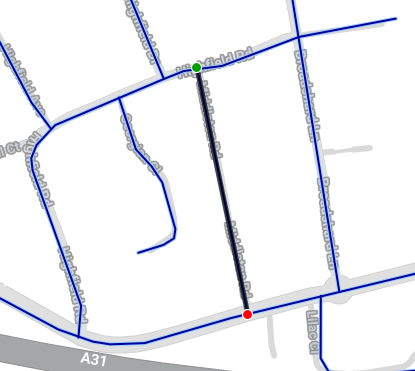
If the Section is longer than 2000m, only a 1000m segment of it will be selected. The start and end points of the segment are marked with black circles. Drag them to adjust the length of the segment as needed.
The label and chainage of the active Section are displayed in the top toolbar. Move your mouse along the active Section to see the chainage at the mouse location.
Section data in the toolbar
| Icon or Text | Function | Description |
|---|---|---|
| Section | - | Shows the ID of the active Section. |
| Link | Shows the URL for the specific Section and data that you are viewing, so that you can share the view with other users. | |
 | Coordinates | Select this icon and click any point on the map to show the coordinates at the selected location. |
| Chainage | - | Shows the current distance within the length (chainage) of the Section. This updates as you move the cursor within the active Section. |
| Road Name | - | Displays the name of the road if known. |
| Pop-outs | Switch pop-outs on or off | When switched on, selecting a section will display any available pop-out icons alongside it. |
A line displayed for a Section doesn't represent each lane of the Section separately. To display multiple lines for individual lanes, select a Layer where individual lanes have data (e.g. PMS Inventory CW Layer).
Data items
Any active Layers containing data associated with the active Section become interactive. Any referenced data, from asset information to proposed Treatments, can be represented as data items. Items are represented as icons that pop-out from the Section, displaying the short code and colour of the Layer they belong to (see below).
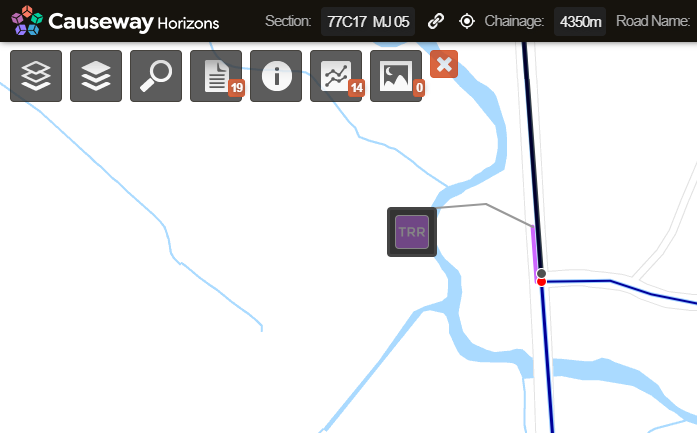
Click a pop-out or the item itself to select it. When selected, the item will be displayed more prominently on the map and its icon will appear larger.
For survey condition datasets, data is represented in fixed length subsections, e.g. 10 m or 100 m chunks. This can result in a lot of pop-outs! To hide them, turn off the Pop-Outs button in the top toolbar (only when a Section is active).

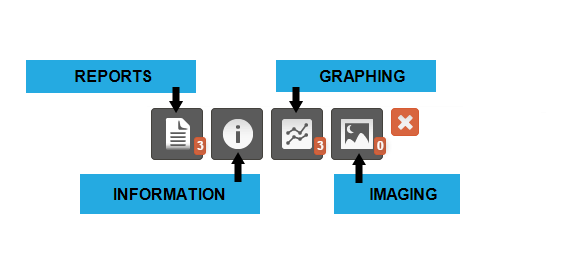
Available tools
When a Section is active, the following icons become populated with data for it:
-
Reports - view formatted reports for the active Section and Section Item.
-
Information - view the standard data of the active Section and Section Item.
-
Graphing - plot condition data from available surveys along a horizontal graph.
-
Imaging - view and navigate stills from available video surveys.
The badges indicate the number of data sources available for the active Section. To deselect the Section, click the red X icon.