Select a Section
View detailed information and Layer data
A Section is an individual asset length in your Network. It typically represents an uninterrupted stretch of highway.
When you navigate the map at Network Level, only summary data is displayed. When you zoom in and select a Section, you can view its information and any Layer data items located on it. If available, you can view graphing and imagery data for the Section. Use deep links to share specific Section views with colleagues.
Select a Section
To select a Section on the map:
-
Enter Interaction Level:
-
Zoom into the map until Sections become hoverable.
-
Use the Interaction tool in the bottom-right corner.
-
Perform a search and choose a result.
-
-
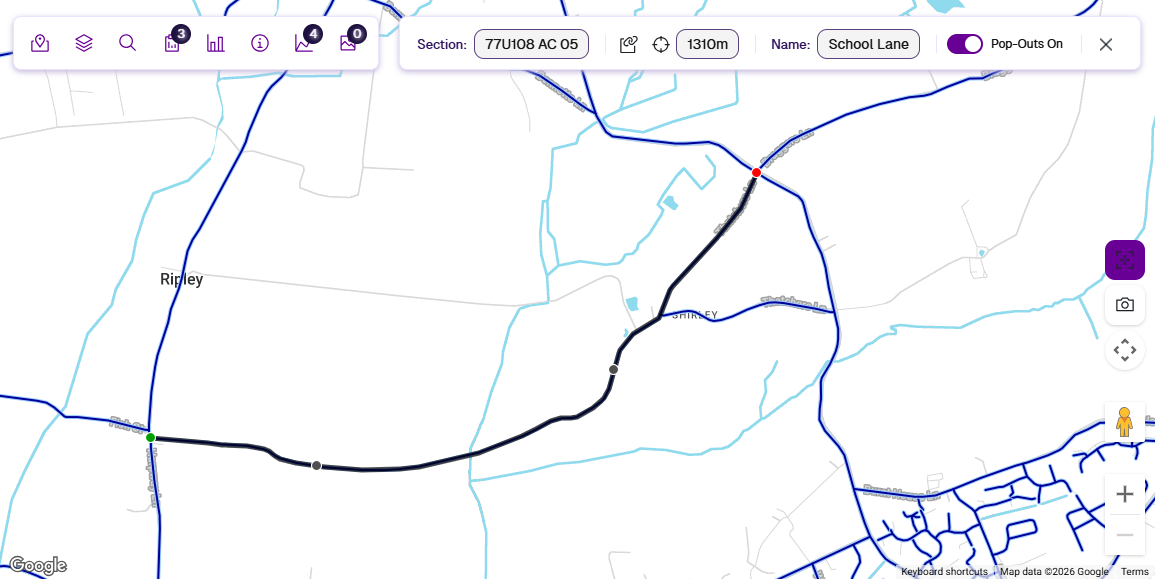
Hover over a Section to highlight its full length. Select it at the point you want to examine.
-
If the Section is over 2000 m, a 1000 m segment is selected automatically (up to 500 m either side of your selection). This is indicated by black circles. Drag them to adjust the active segment.
The Explorer toolbar updates to show the total number of available data sources. The Section toolbar appears with key details about the Section. Green and red circles mark where the Section starts and ends on the map.
Explore Section data
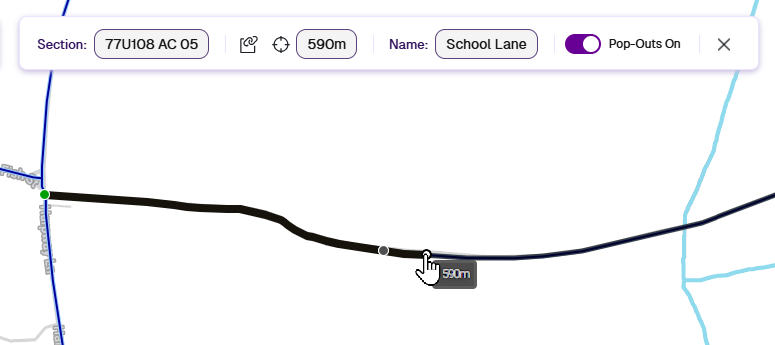
The Section toolbar displays the label and chainage of the active Section. The chainage updates as you hover along the Section. To get the coordinates of any location, select Get coordinates and then the location.
Layer data items
If the active Layers contain any data for the active Section, those data items are rendered on the map according to their geometry. An item may appear as a point, line or polygon along the Section length, offset from the centreline.
Items can represent any type of data, such as:
-
linear assets, e.g. carriageways, footways, kerbs
-
non-linear assets, e.g. street lights, gullies, signs
-
survey measurements, e.g. SCANNER, Deflectograph, CVI
-
condition metrics, e.g. PAS 2161, RCI
-
statistical data, e.g. accident records, traffic flow
-
generated Treatment schemes
By default, item pop-outs are shown. For each item, a connected pop-out icon appears, with the short code and colour of the corresponding Layer Style. Pop-outs make it easier to identify and select items without having to zoom in. Hover over a pop-out to highlight the linked item.
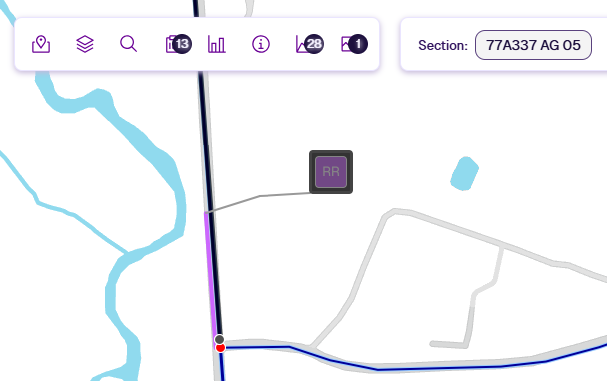
If a Layer has multiple items at the same location on the Section, they share a single pop-out with a red number badge. Select the badge to reveal the individual pop-outs, which you can then hover over and select.
To turn pop-outs on or off, use the switch in the Section toolbar.
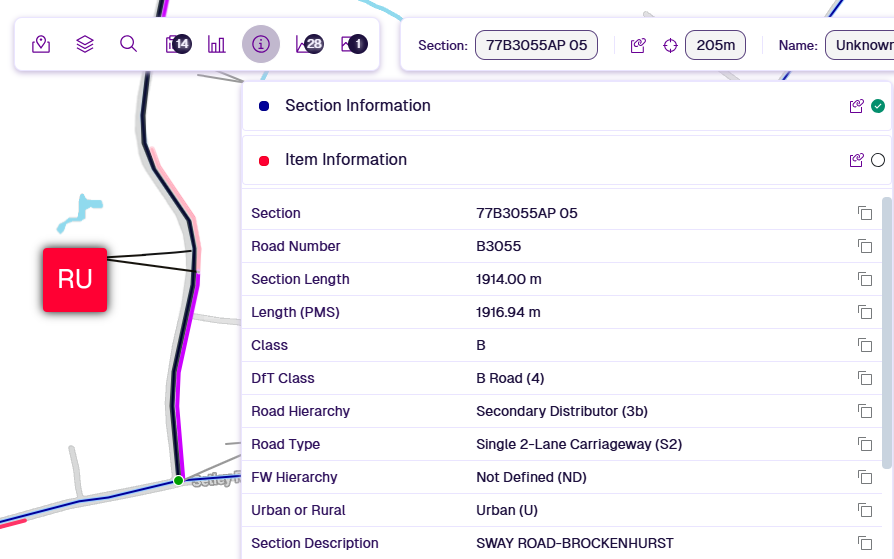
Information
To view detailed information for the active Section, select Section Details in the Explorer toolbar. Standard data fields appear alongside any custom fields specific to your project. If an item is selected on the Section, select Item Information to switch to its data fields. To copy a value, select its Copy button.
Available tools
Use the Explorer toolbar to access more data for the active Section. The badges indicate the number of available data sources.

-
Reports - view formatted reports for the active Section and selected item.
-
Graphing - plot condition values from survey data along a horizontal graph.
-
Imaging - navigate captured video and surface scans.
Link to a Section
To share your current Section view with other users in your company project, select Link to Section in the Section toolbar. This generates a deep link to the active Section, including the active Layers and current basemap imagery. Right-click the highlighted URL and choose Copy or press Ctrl+C.
Anyone who follows the link must sign into CausewayOne Asset Strategy before the Section is displayed.

Close the Section
You can't zoom out of Interaction Level while a Section is active. To close the Section, select Close in the Section toolbar. Alternatively, use the Interaction tool, which also zooms out to Network Level.