Summary Reports
View summary data in an interactive chart
Summary Reports are interactive charts displaying summary data for the corresponding Layer. Summary Reports can be mapped to Networks, Subnetworks or Sections to show detail at different levels of granularity. To change the scope of a Summary Report, select the desired portion of your Network.
To view the Summary Report of a Layer:
-
Select the top Layers icon. In the dropdown, select a Layer, so that it appears on the map.
-
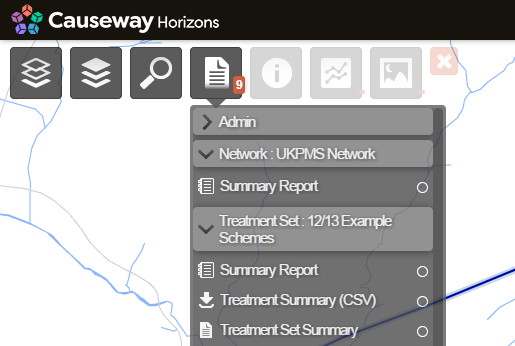
Select the top Reports icon. In the dropdown, open the folder for the selected Layer.
-
Select the
 Summary Report inside. It will open in a new window.
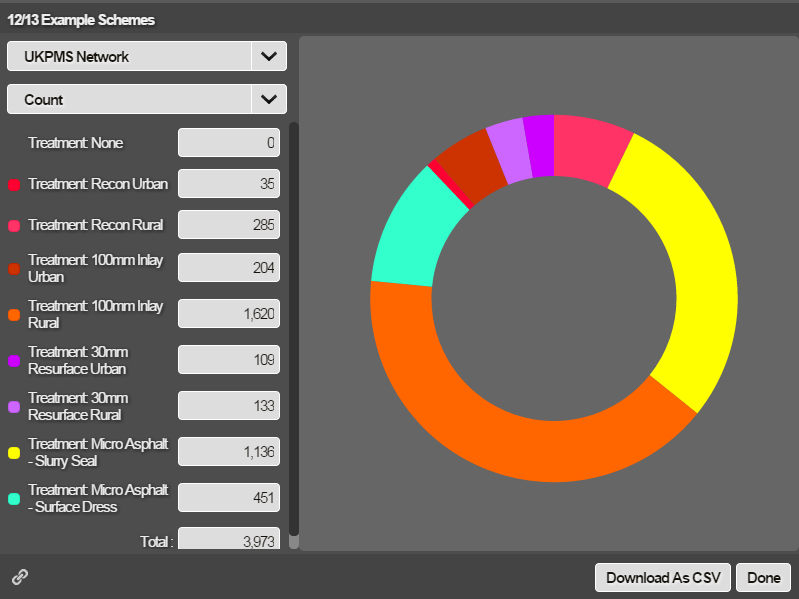
How to use
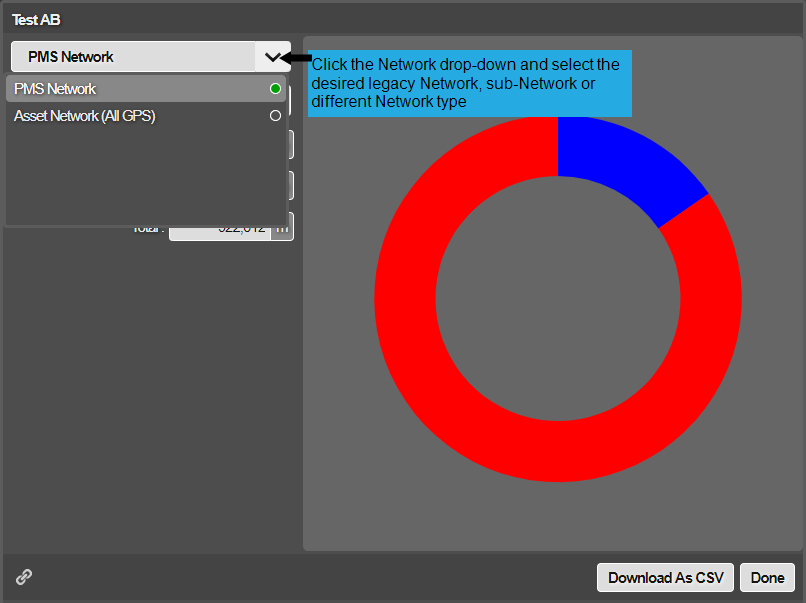
Change Network
To view the summary data for a different Network or Subnetwork, select it in the top box.
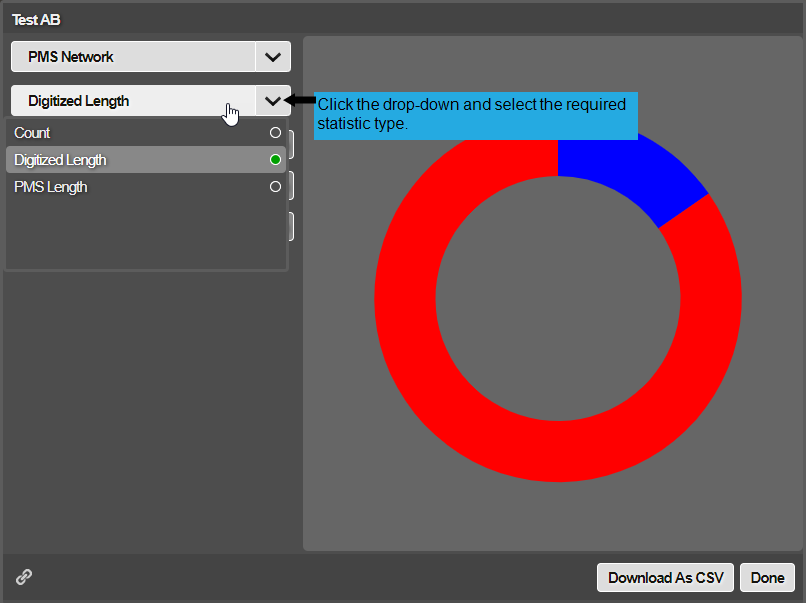
Change statistics
To change the type of summary data displayed, select it in the second top box. The available statistics depend on the spatial data of the corresponding Layer:
- Points: Count
- Lines: Count, Digitised Length (m), PMS Length (m)
- Polygons: Area (m2), Count, Digitised Length (perimeter) (m), PMS Length (m)
Digitised vs PMS Lengths
Networks can contain both digitised lengths and PMS lengths.
Digitized length relates to the spatial length of the line or polygon within the two-dimensional mapping.
PMS length is the chainage length of the item as used in PMS systems. This is the PMS end-chainage minus start-chainage for the item ranging from 0 to the PMS Length of the Section (i.e. the PMS Measured Length entered for the Section).
Normally the difference between the two is minor. For example, if a linear item such as a safety fence extends along the entire length of the Section, the digitised length might be 100m, but the subsection length (which is related to the PMS measured length of the Section) may be 110m.
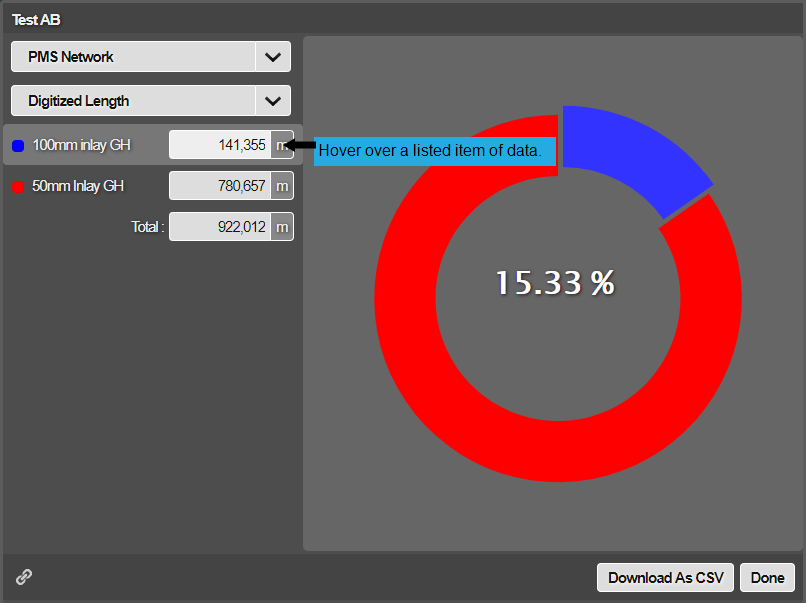
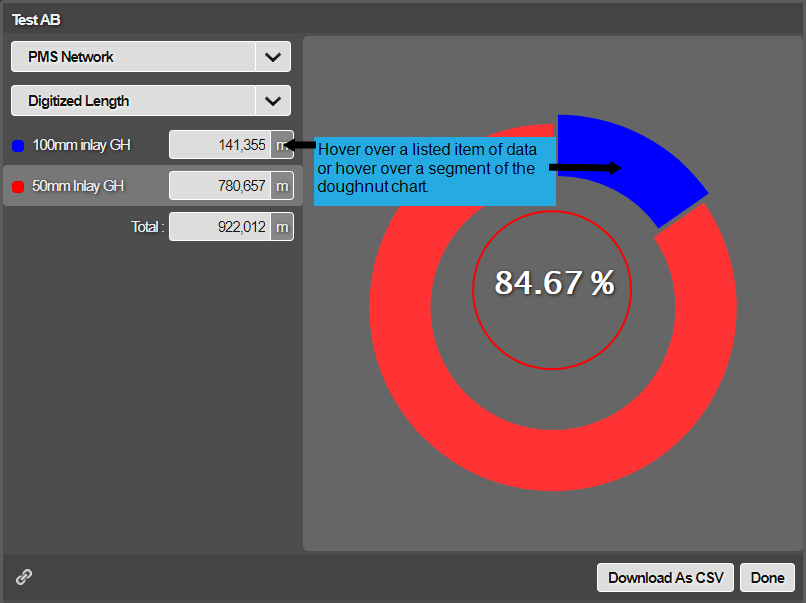
Highlight data
Select a data item in the list to highlight the corresponding section of the chart.
Select a section of the chart to highlight the corresponding data item in the list.
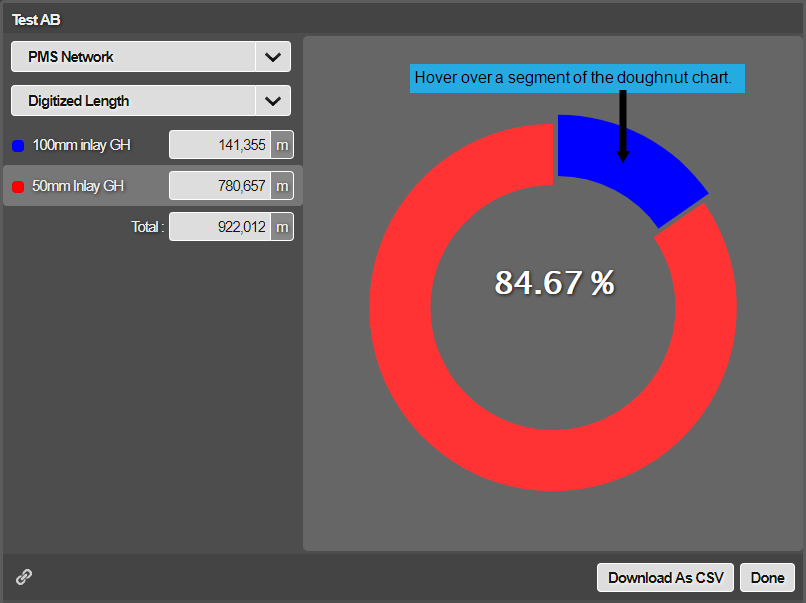
Do either of the above to display the percentage proportion of the selected data item.
Share and Export
To share the Summary Report with other users in your company project, select the Link icon in the bottom-left corner. This will copy the URL to your device's clipboard. To open the link, users must be logged in and have the necessary permissions and product licences required to view the Report.
To export the raw data of the Summary Report, select Download As CSV in the bottom-right corner. Your web browser will shortly begin downloading the file.