Reports
Stay informed with formatted reports and charts
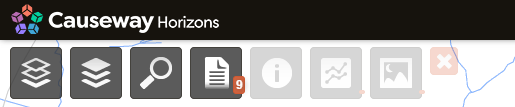
Whenever a Layer or Section is selected, the top Reports icon is updated to include the Report(s) for your selection. The number on the icon indicates the number of Reports that are currently available, based on the currently active Layers, plus any selected Section and Section item.
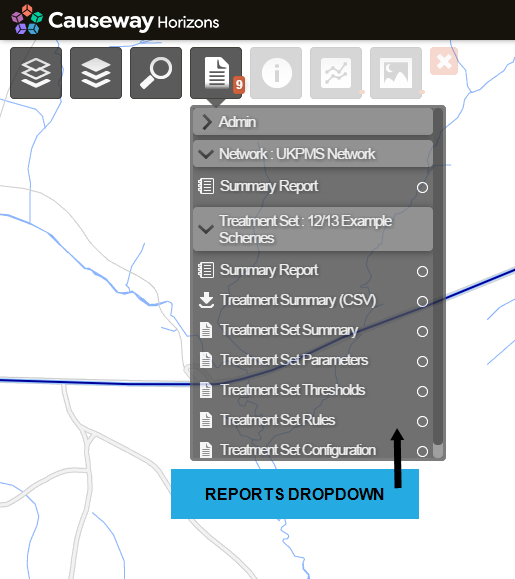
In the dropdown, the available Reports for each selected Layer or Section are organised into separate folders. Each folder can contain a number of Reports, providing data at summary and detailed levels. Some folders may also contain spreadsheets that can be downloaded for use outside of Horizons.
If you have network filtering enabled, you can view detailed reports about a select Subnetwork. See About Network Filtering.
Access to Reports may be limited by your licence or user type. See Setting User Permissions.
Report types
There are three types of Horizons Report. Each one displays an icon to indicate its type.
 Summary Reports
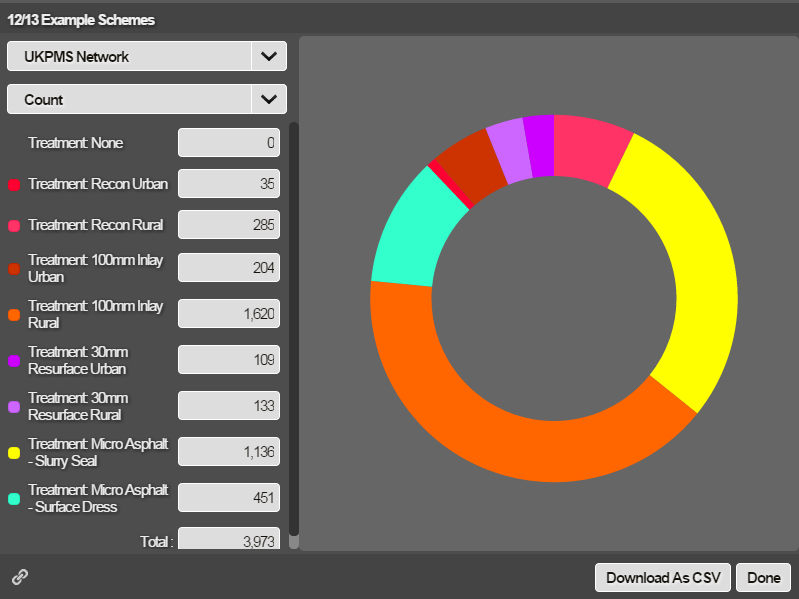
Summary Reports are interactive. You can change the type of statistics that you see in the summary. Hovering over a listed item of data highlights the corresponding segment of the doughnut chart, and vice versa. The percentage proportion of the selected item of data is displayed in the centre of the doughnut chart.
Summary Reports provide an easy way to view the high level statistics of a Layer or Section. For example, the Summary Report for an asset type such as reference markers instantly indicates the number of markers in the dataset (and therefore the Network). Similarly, a Summary Report for a Treatment Set Layer can display the number and length of the Treatments over the Network.
To learn more, see Summary Reports.
Example Summary Report
This is a Summary Report for a Network Layer.
 Detailed Reports
Detailed Reports display as a table in a pop-out window. These are designed to deliver specific information regarding a selected Layer, Section, or Section item. You can print the Report or open it in a new window.
Example Detailed Report
This is a Detailed Report for a Treatment Set Layer.
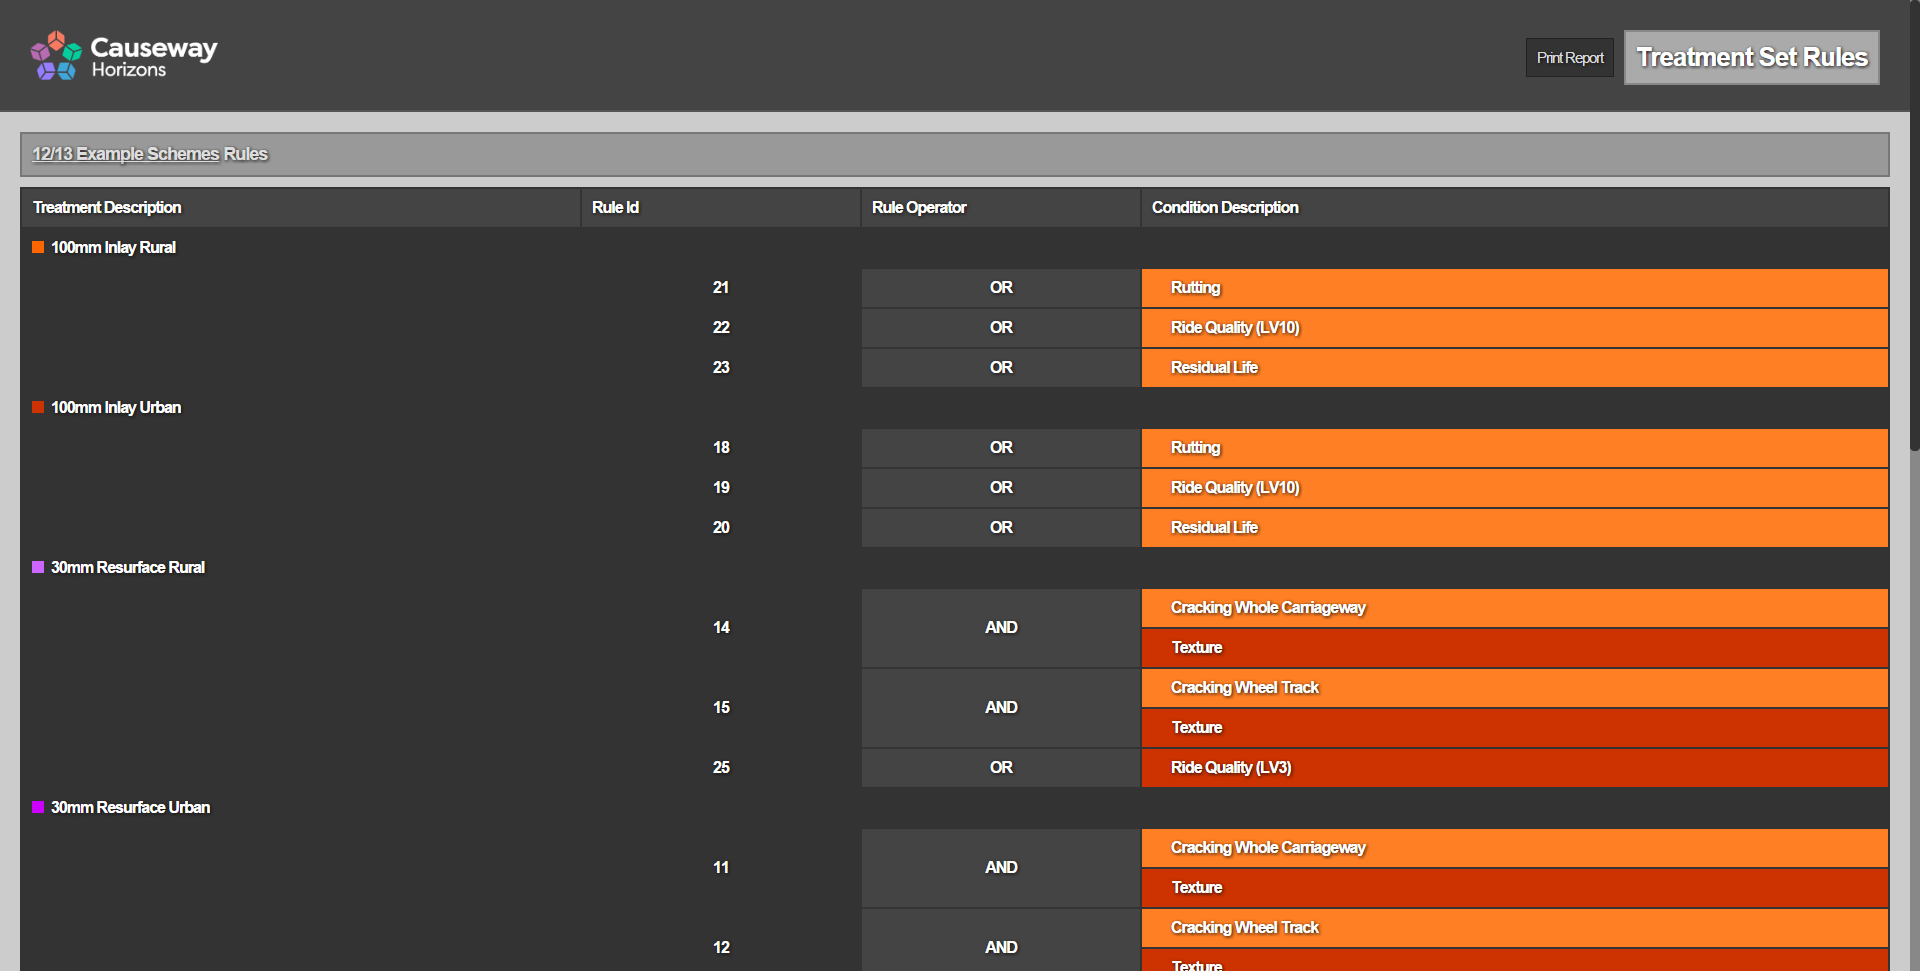
Some Reports are only available by clicking a link within a Detailed Report. Click on underlined text to open related Reports, including linked Sub-Reports.
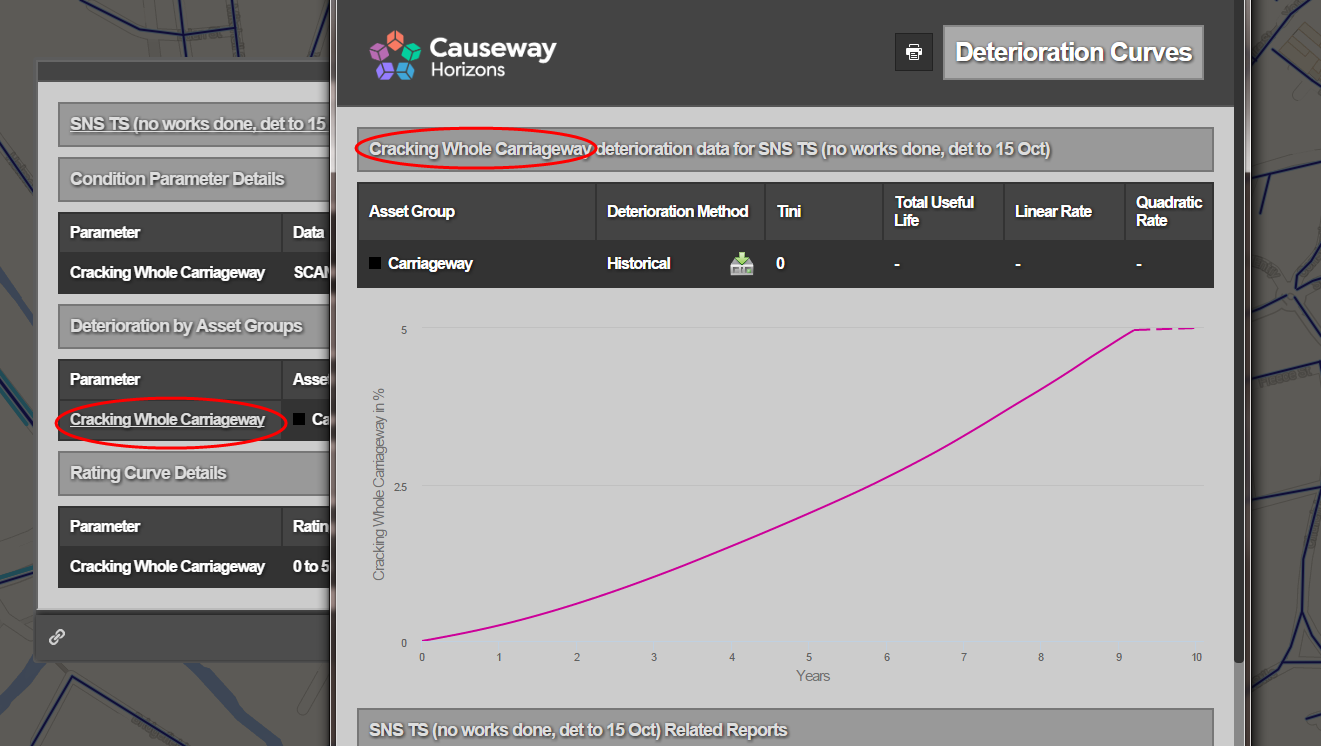
Example Linked Report
This is a Linked Sub-Report that was opened via a link within a Detailed Report.
To learn more, see Detailed Reports.
 Spreadsheet Reports
Spreadsheet Reports are CSV files containing raw, unformatted data. They are available for download, so that the data can be exported for use in other applications. They can't be viewed directly within Horizons.
Available Reports
Horizons provides various Reports for many scenarios. The ones available depend on what you have selected at the time.
Any data or Network Layer
| Report | Description |
|---|---|
| Summary Report | Interactive report. You can change the information type for the summary using the drop-down |
Section
| Report | Description |
|---|---|
| Section Summary | When a Section is selected, the Section Report provides full details of the Section. |
| Treatment Set (Section Details) | When a Section and a Treatment Set Layer is selected, the Section Treatment Set Report provides the details of the Treatments that are identified for the Section. Use this to verify analysis output. |
| Works Plan (Section Details) | When a Section and a Works Plan is selected, the Section Works Plan Report provides the details of the proposed works that are identified for the Section. Use this to verify analysis output. |
Section Item
| Report | Description |
|---|---|
| Section Item Summary | When a Section Item is selected, the Section Item Report provides full details of the Section Item. |
| Scheme Analysis Report | When a Section Item that describes a scheme (eg. Works Plan, Treatment Set, or imported scheme) is selected, the Scheme Analysis Report compares the scheme's condition parameters against the rest of the network. |
Treatment Set Layer
| Report | Description |
|---|---|
| Treatment Summary (CSV) | CSV report of all Sections with treatment quantities for current financial year. By default this will be referenced against the most recent version of your Network. |
| Treatment Set Summary | Report detailing input parameters for the selected Treatment Set, including cost and quantity for each Treatment in the Set. |
| Treatment Set Thresholds | Report listing the thresholds for each condition parameter used in the Treatment Set setup. |
| Treatment Set Rules | Report listing rules for each of treatments added to the Treatment Set setup. |
| Treatment Set Configuration | Report with details on the treatments used within the Treatment Set. |
| Treatment Set Parameters | Report with details about all condition parameters analysed in the Treatment Set. Provides access to Deterioration Curves Sub-Report. |
| Deterioration Curves | Linked Sub-Report with parameter deterioration curves for analysed asset groups, as they were at the time the Treatment Set was run. Can only be accessed by link from Parameters Table in Treatment Set Parameters Report. |
| Treatments for XSP and year | Linked Sub-Report with information about section deterioration and treatments decisions. Can only be accessed by XSP link within the Treatment Set Section Summary Report. |
Works Plan Year Layer
| Report | Description |
|---|---|
| Treatment Summary (CSV) | CSV report of all Sections with treatment quantities broken down by financial year. |
| Works Plan Summary | Report describing Works Plan input parameters and comparison of results between scenarios. Report includes Works Plan monitors and strategies and contains link to Works Plan Sub-Report. |
| Works Plan Scenario | Detailed Works Plan scenarios report, including treatment types and cost by year. By default this will be referenced against the most recent version of your Network. In the Reports dropdown, an (R) displays beside the recommended scenario. |
| Works Plan Monitor | Linked Sub-Report covering the value of Works Plan monitors per Financial Year and scenario. Can only be accessed by link from Monitors Table within Works Plan Summary Report. |
| Treatments for XSP and year | Linked Sub-Report with information about section deterioration and treatments decisions. Can only be accessed by financial year link in Works Plan Section Summary Report. |
UKPMS Report Layer
| Report | Description |
|---|---|
| Data Topic 130-01 | Report with Performance Indicator (PI) values for England A roads. |
| Data Topic 130-02 | Report with Performance Indicator (PI) values for England B & C roads. |
| FNS Condition Summary | UKPMS Footway Network Survey summary with condition levels breakdown. |
| BVPI 187 | Best Value Performance Indicator Report for Condition of Footways. |
| BVPI 224b | Best Value Performance Indicator Report for Condition of Non-Principal Unclassified Roads. |
| Unclassified Visual Survey | Best Value Performance Indicator Report for condition of unclassified roads based on the latest of CVI or DVI data. |
| HAMFIG Carriageway Inventory | Report detailing carriageway inventory data and SCANNER, CVI, and DVI condition data. |
| SRMCS | Scottish Roads Maintenance Condition Survey Report, including Scottish Performance Indicator (PI) report for A, B C and U roads. |
| THS/012 | Welsh Performance Indicator (PI) report for A, B and C roads. |
| Unclassified SCANNER | SCANNER survey report for unclassified roads. |
| HECI | Report gives condition scores over the network classified into green, amber, and red bands. |
Linking to Reports
You can copy and share a link to any Report by using the Link icon displayed at the bottom of it. To open the link, users must be logged into Horizons and have the necessary permissions and product licences required to view the Report.