Map navigation
Explore and zoom the map
The map is central to CausewayOne Asset Strategy. It lets you browse your Network and visualise your asset data spatially. Use the controls and tools below to navigate and zoom between Network Level (a broad overview) and Interaction Level (selectable Sections).
To navigate to an address, Section or coordinates, see Search.
Map controls
The map supports mouse, keyboard, and touch controls for navigation.
| Action | Mouse | Keyboard | Touch |
|---|---|---|---|
| Pan | Drag in any direction | Up Down Left Right | Single-finger drag |
| Zoom in | Scroll up or double-click | Plus | Pinch open |
| Zoom out | Scroll down | Minus | Pinch close |
| Zoom to area | Hold Shift and drag diagonally to draw a box | — | — |
Map tools
To navigate the map, use the tools in the bottom-right corner.
| Tool | Name | Description | |
|---|---|---|---|
 | Interaction | Zoom into Interaction Level, where Sections become selectable. The tool turns purple to indicate this. Select it again to zoom out to Network Level. | Explorer only |
 | Print the current map area. To save it as a PDF, choose a virtual PDF printer (if available). | ||
 | Tilt | Only appears for zoomed in areas with tilt imagery on Satellite/Hybrid basemaps. Use the rotate buttons to change the angle. | |
 | Pan | Use the arrow buttons to move the map in four directions. | |
 | Street View | Drag Pegman onto a highlighted part of the map to open Google Street View. To exit, select the back arrow (top-left). | |
 | Zoom in | Zoom into the centre of the map. | |
| Zoom out | Zoom out from the centre of the map. | ||
Zoom levels
The map has two distinct zoom levels that affect how spatial data is displayed and what you can interact with.
Network Level
Network Level is the default. It presents a broad view of your Network assets, showing you how their data is distributed at a glance. Sections are visible but not selectable. The data items of active Layers appear as coloured lines along each Section (even if they're stored as points or polygons), to keep things readable at a distance.
You can zoom in for more detail, though zooming too far will switch you to Interaction Level! To return to Network Level, use the Interaction tool in the bottom-right corner to display your entire Network.
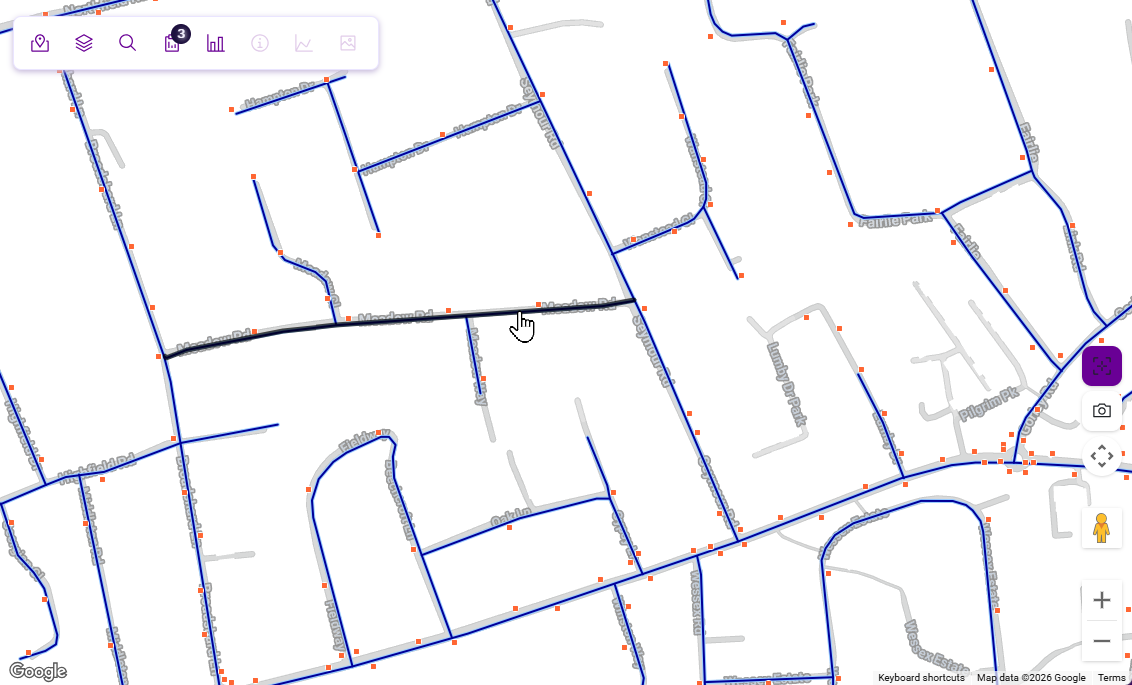
Interaction Level
To enter Interaction Level, zoom into an area of interest, or use the Interaction tool to zoom directly into the centre of the map.
After zooming in far enough:
-
Individual Sections become selectable. Hover over one to highlight it, then select to view its details.
-
Line data items are offset correctly from the Section centreline, e.g. footway items appear beside carriageway items, not on top.
-
Point and polygon data items appear in their true geographic positions, e.g. the street lights illustrated below.
The Interaction tool turns purple when Interaction Level is active.