Viewing Data
Viewing Layer data on the map
After selecting a Network and one or more Layers, the roads of the Network and the information from each Layer's data source become visible on the map. The data is colour-coded to help you identify what it represents. You can see the colours that are assigned to a Layer by hovering over the Layer name in the legend is displayed.
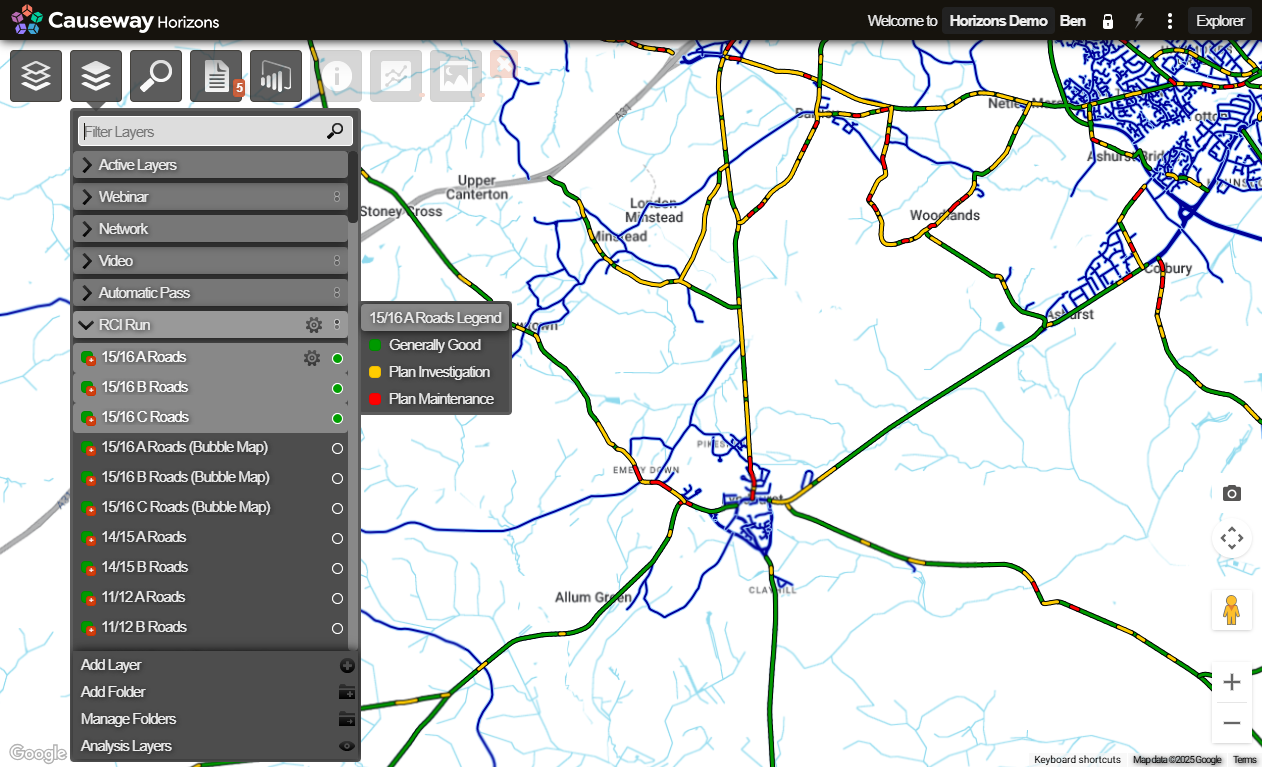
The more you zoom into the map the more detail you can see of the data. You can only interact with the data when you zoom far enough into the map to enable Interaction Level.
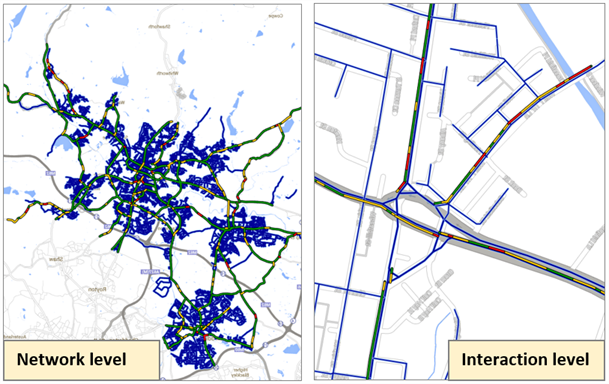
The active Layers are overlaid on the Network. When zoomed out to Network Level, all data is presented as lines on the Network irrespective of the true geometric representation of the data (points, lines, and polygons). The screen shot on the left below shows a road condition Layer configured with red, amber, and green, at Network Level. When you zoom in, you can see the patches of road condition in more detail.
Due to the way that information is displayed, areas of poor condition (red and amber) appear more pronounced when looking at the Network Level. Zooming in shows the precise location of this data.