Use Bubble Mapping
Visualise data as bubbles
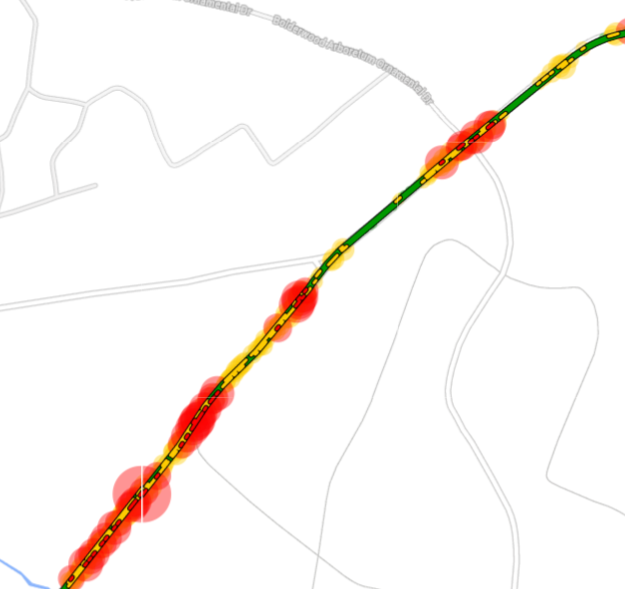
You can enable bubble mapping for any Layer containing line or point data. This provides added depth and detail when visualising the Layer's data on the map. When enabled, a bubble is displayed over each asset subsection. The size and opacity of each bubble indicates the intensity of the subsection's data.
To enable bubble mapping for a Layer:
-
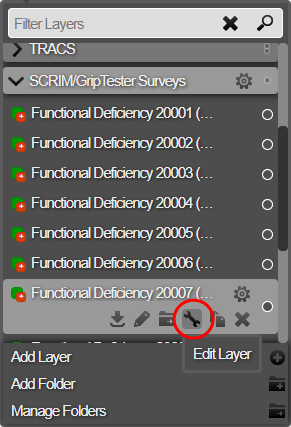
Select the top Layers icon. In the dropdown, open the folder containing the relevant Layer.
-
Hover over the Layer, select its Options icon, and then select the Edit Layer icon that appears below it.
-
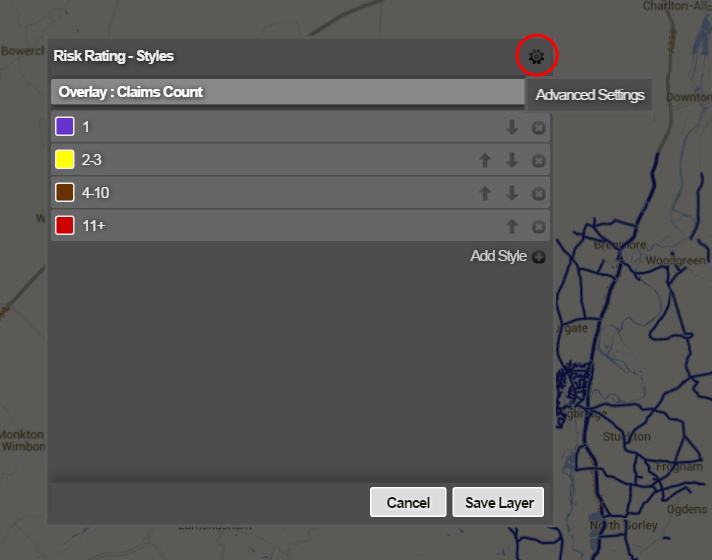
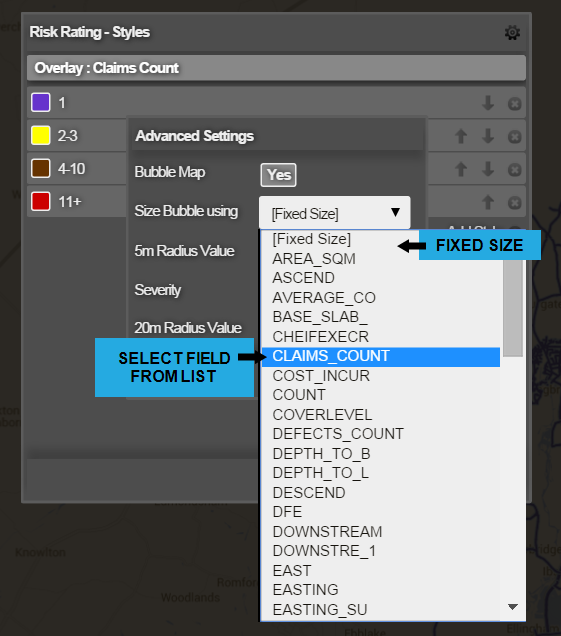
In the Styles window, select the Advanced Settings (cog/gear) icon in the top-right corner.
-
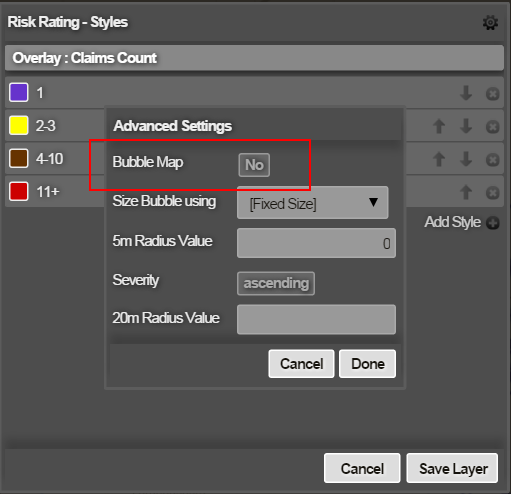
Select the No button beside the Bubble Map option to turn it on.
-
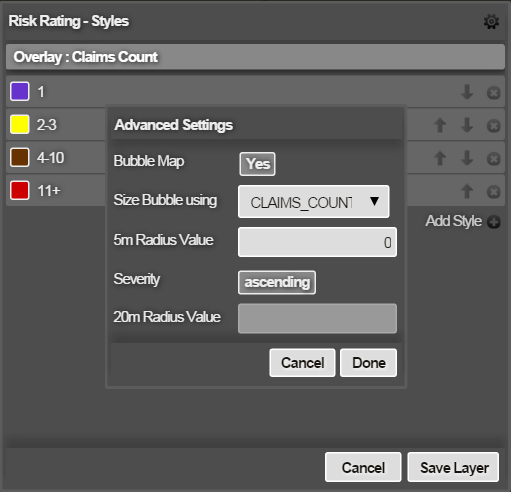
To set the bubble size, select the Size Bubble using box. Choose Fixed Size to display all bubbles at the same size. Alternatively, you can scale the size of the bubble according to the value of a numeric field in the Layer's data source.
-
To set the scale factor, enter a value in the 5m Radius Value box. Enter a value for which the bubble radius will be 5m when viewed zoomed-in on the map. This is typically a low value, such as 1, 2 or 3.
In the example below, setting this to "3" means that a CLAIMS_COUNT value of "3" will generate a 5m bubble, while a CLAIMS_COUNT value of "12" will generate a 20m bubble.
-
By default, Severity is set to Ascending. However, if your field represents a value that gets more severe when descending (e.g. road surface texture), select this to change it to Descending, and specify a 20m Radius Value to define the scaling in this case.
-
Select Done and then Save Layer to finish.