Creating Deterioration Bounds Layers
Creating a Layer from a Condition Parameter
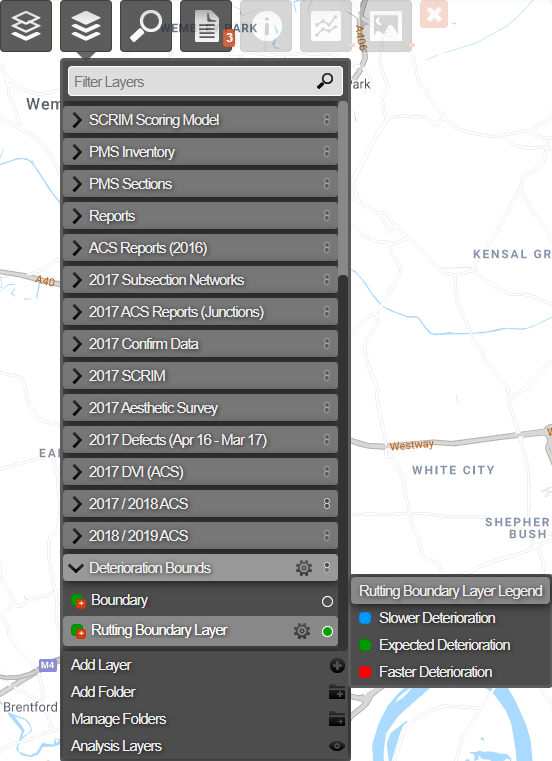
You can create a new Layer based on a Condition Parameter that has defined deterioration bounds. This provides a colour-coded visualisation of the deterioration levels of your assets, according to available survey data. You can see which subsections are deteriorating as expected, faster than expected or slower than expected for the selected parameter (e.g. rutting, whole carriageway cracking).
Before creating the Layer, make sure that your chosen Condition Parameter has been configured with deterioration bounds. See Define Deterioration Curve.
To create a new Deterioration Bounds Layer:
-
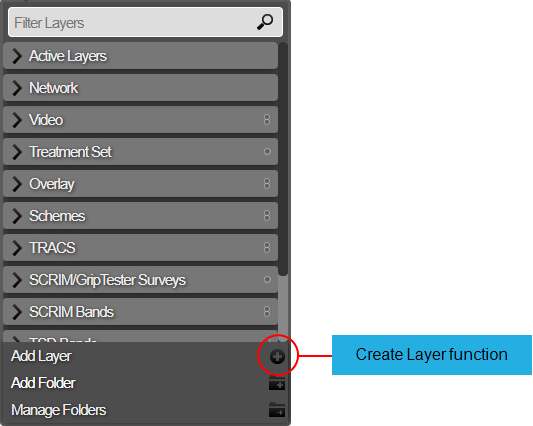
Select the top Layers icon. In the dropdown, select Add Layer.
-
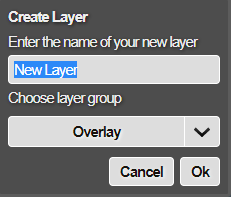
Enter a unique name for the new Layer, based on the data it will represent. For the Layer Group, choose the Deterioration Bounds folder. If it doesn't exist, choose any other for now (the folder will be created automatically). Select OK to continue.
-
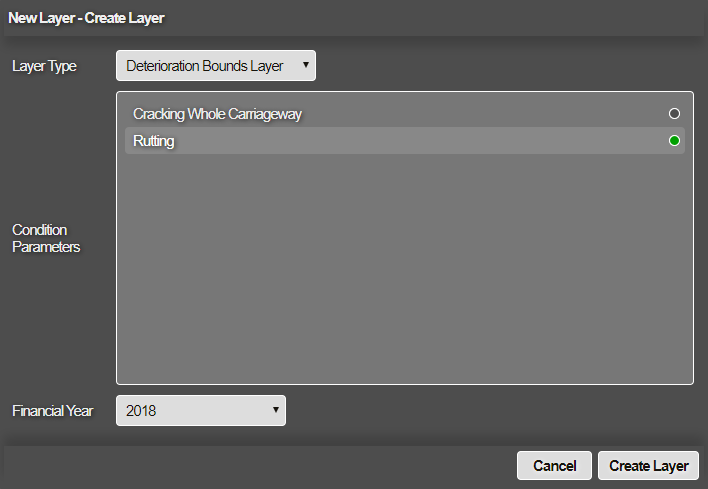
In the Create Layer window, select the Layer Type box and choose Deterioration Bounds Layer. Choose one of the available Condition Parameters from the list. Only those with deterioration bounds will be shown.
-
Select the Financial Year box and choose one from the list. Only those with survey data for the chosen Condition Parameter will be listed. When you select a year, for each subsection the calculation considers the surveys in latest earlier year and earliest next year (including the year itself) across the selected year.
infoFor the Condition Parameter and the Financial year selection, it is possible that the roads belonging to a particular asset group (for which bounds are defined) are not present in the survey data. The system will not proceed with the layer creation if this situation occurs.
You will receive an error message suggesting the asset groups for which bounds have to be defined first, to be able to create the Bounds layer for the chosen combination of condition parameter and financial year.
-
Select Create Layer to finish.
A notification indicates that the Layer has been created and saved, select OK to return to the map. Once the bounds have been generated you will receive an email to indicate the success or failure of the calculations.
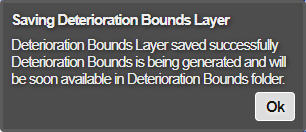
If the new Layer is generated successfully, the system will create a Deterioration Bounds folder if it didn't already exist, and put the new Layer inside it.
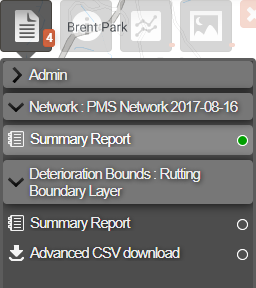
CSV Report
An Advanced CSV report is automatically generated for each Deterioration Bounds Layer. To download it, select the Layer to show it on the map. Select the top Reports icon, select the active Layer, and then select Advanced CSV download. To learn more, see Reports.