Horizons Explorer
Browse and visualise your data on the map
The Explorer module displays your asset Network as an interactive map. Imported data from various sources can be displayed over the basemap imagery, letting you see all kinds of information about the individual asset Sections within your Network.
Explore the map
Using the map controls, you can pan around and zoom into areas of interest, similar to Google Maps. The icons along the top provide access to the key features included with Horizons. You can also search for street addresses, Sections, data items and coordinates.
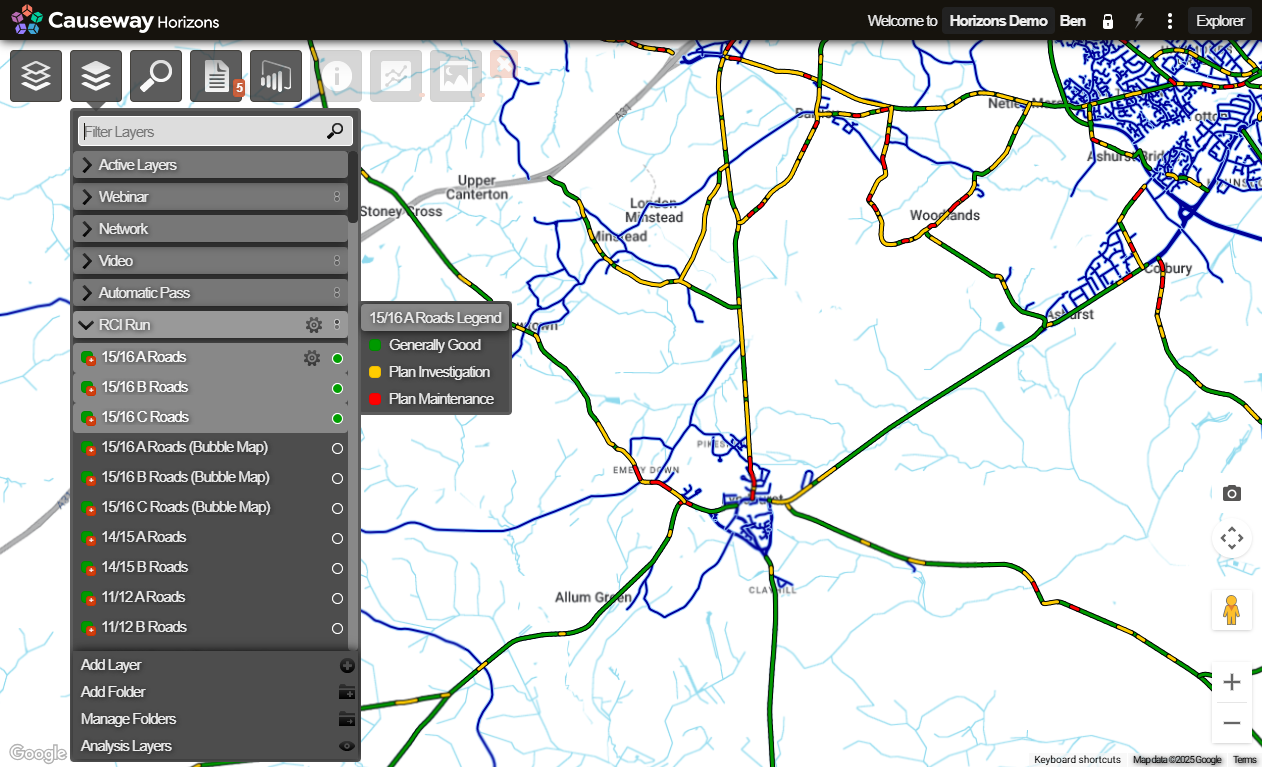
Understand Layers
Networks and the data associated with them can be displayed on the map as Layers. You can select a single Network Layer and overlay it with up to six Layers of data.
Interact with the data
When you zoom in close enough, the Sections of your Network become interactive. You can then access item-specific Graphing, Imagery, and Reports.
View Reports
You can view formatted Reports about your data and export them for use in another software tools. Each Layer is linked to one or more Reports. You can also view Network-level charts and Summary Reports.
View Graphing data
You can see how the condition of an asset varies over a Section length. The bottom Graphing panel plots condition data for the Section along a horizontal graph. This lets you compare multiple measurements and identify problems.
View Imagery
You can view Imagery data captured for a Section during surveys. View and navigate video imagery within a thumbnail view, or use the fullscreen Imaging module to view imagery at full resolution and access additional functionality.
Some Explorer features may be limited by your licence or only accessible by admin users. See Setting User Permissions in the Management module.