Zooming into the Graph
View a portion of the graph in more detail
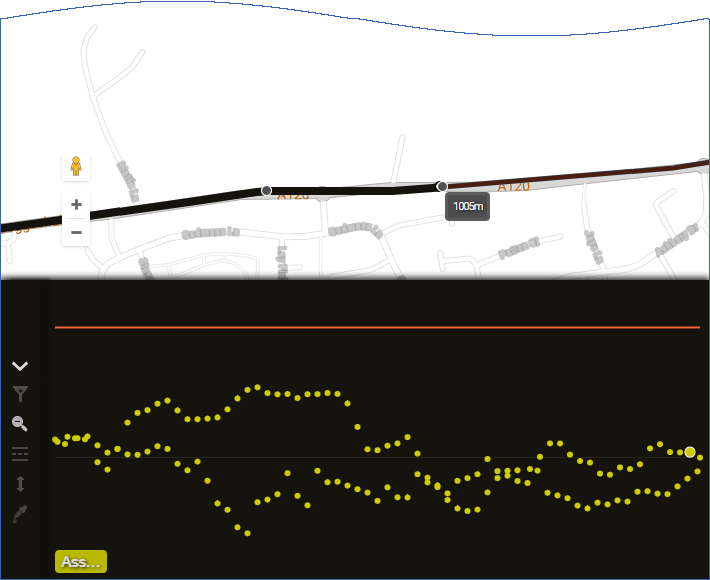
When one or more Condition Parameters are selected for the active Section, they appear in the Graphing Panel at the bottom of the map.
To see more detail, you can zoom into a portion of the graph. This has the effect of spreading a subset of data points over a greater area. This can provide greater clarity when dealing with clusters of data points located close together.
info
This is the same as selecting a segment of the active subsection on the map.
Zoom in
To zoom into the graph:
-
Position your mouse cursor at the position you want to zoom in from.
-
Select and drag sideways. The area that will be zoomed is indicated by a grey box highlight.
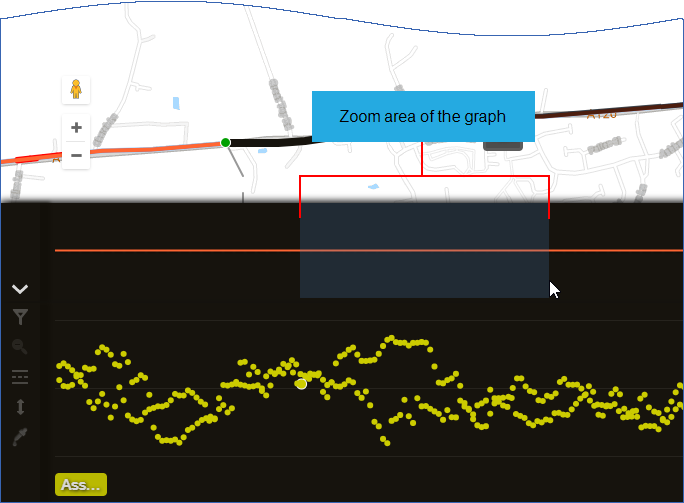
-
Release the mouse button at your desired end position.