Understanding Graphs
How to interpret the displayed data
When one or more Condition Parameters are selected for the active Section, they appear in the Graphing Panel at the bottom of the map.
Each selected parameter appears as a separate line or set of points on the graph, with its own distinct colour. If a parameter has data that was measured on multiple XSPs (e.g. road lanes), that parameter is represented multiple times (as illustrated below).
Move your mouse along the panel to highlight the data values recorded at each chainage position along the Section length. The current chainage is simultaneously highlighted along the Section on the map. Information for the current chainage is displayed on the left/right side. It includes the name, Feature Code, XSP Code and data value of each parameter at that chainage. Select your position to lock it there. Select again to unlock.
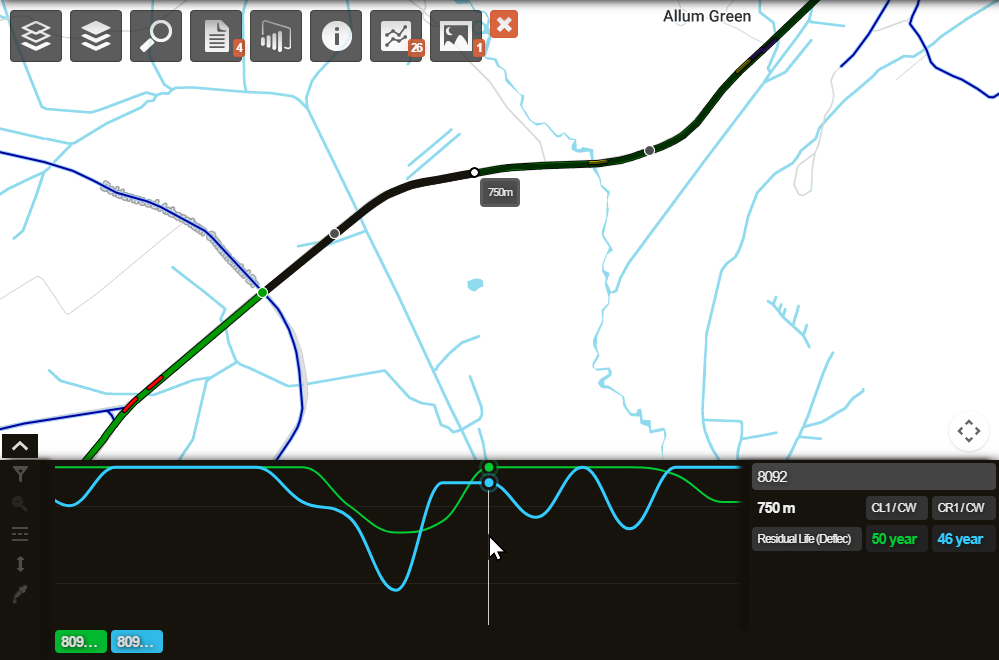
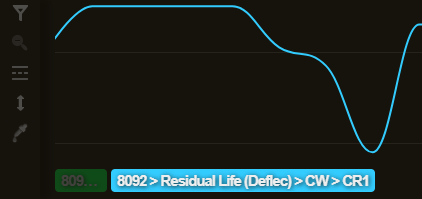
Each parameter has a corresponding button in the bottom-left corner. Hover over a button to see its full name, Feature Code and XSP code. Use the buttons to turn individual parameters on/off as needed, without having to deselect them in the Graphing dropdown.
XSP View
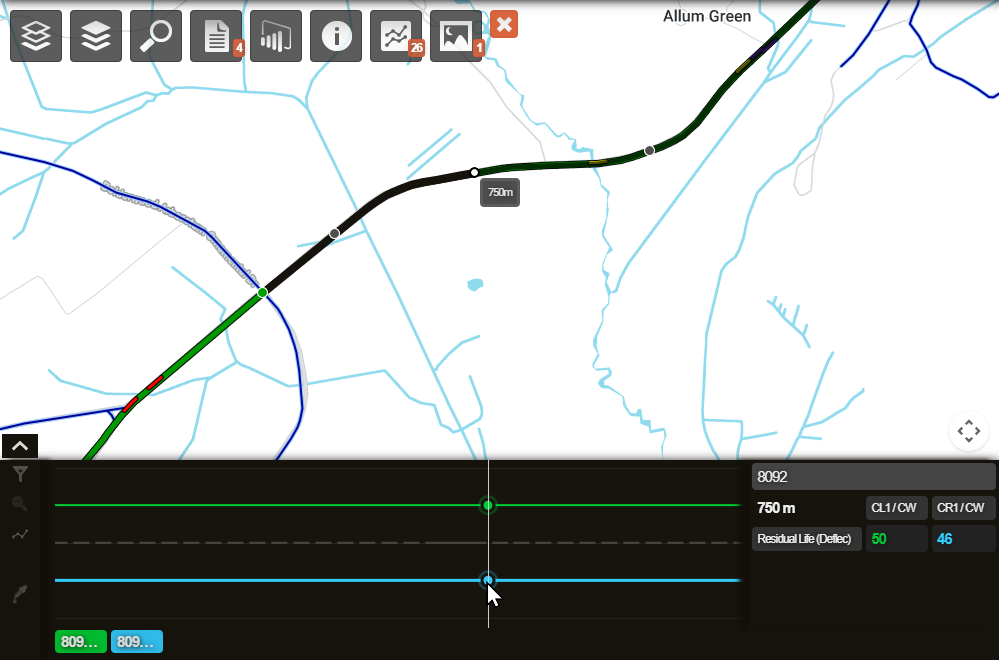
If a parameter has data that was measured on multiple XSPs, you can visualise their position on the road by selecting the ![]() Go to XSP View icon on the left.
Go to XSP View icon on the left.
XSP View shows the road lanes, carriageways, and footways as grey patterning in the background beneath the coloured data lines. This additional visualisation helps you to correlate the data with the XSPs it belongs to.
For example, you may want to only see data for the left carriageway (CL1). You can go to XSP View and use the Filter XSP button to turn off the right carriageway (CR1). When you return to Graph View, data will be only shown for the left carriageway.
Graph View controls
The following controls are available down the left edge of the Graphing panel.
Filter by Feature Code
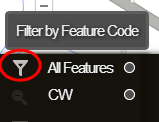
Filter the data by Feature Code. This lets you show or hide data for specific asset classes. The filter remains in place if you switch to XSP View, so you will only see XSPs that relate to the filtered features.
Alternatively, use the bottom-left legend buttons to temporarily hide feature data from the graph, or deselect it in the Graphing dropdown to remove it completely.
Feature Codes
A Feature is a physical part of the road. For full details, consult the UKPMS user manual.
| Feature Name | Feature Code | Description |
|---|---|---|
| Carriageway | CW | The main running surface for vehicles. |
| Footway | FW | Areas designated for pedestrian use. |
| Kerb | KB | The kerb or channel line (often includes drainage). |
| Verge | VG | Grassed or soft-landscaped areas. |
| Cycle Track | CT | Dedicated paths for bicycles. |
| Asset Strategy only: | ||
| Bridge | BR | Bridge structures. |
| White Markings | WM | Painted road markings. |
Reset Zoom
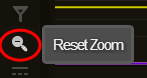
If you've zoomed into a portion of the graph, you can use this to zoom back out, so that the entire Section length is visible again.
Go to XSP View
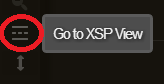
When viewing parameter data that was measured across several XSPs (e.g. road lanes, footways), switch over to XSP View to visualise their position on the road.
Scale to Fit
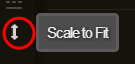
By default, parameter values are scaled to maximise the visible range on the graph. However, sometimes you need to display values with the same units of measurement on the same scale. Select this icon to switch between Scale to Fit and Actual Scale mode.
Pick Colours
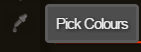
Use this to change the colour of any parameter on the graph.
XSP View controls
Filter by XSP
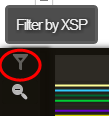
Use this filter to show or hide parameters in a specific XSP (e.g. road lane, footway). The filter remains in place if you switch to Graph View, so you will only see the data that relates to the filtered XSPs.
Common XSP Codes
An XSP (Cross Section Position) describes where something sits across the width of a road.
Carriageway lanes are numbered from the nearside edge toward the centre. For single carriageways, use CL codes only. Features outside the carriageway (kerbs, footways, verges) use Off Carriageway Position codes, numbered outward from the carriageway.
Minimal codes give a generic position for the whole carriageway or one side when precise position isn't important. Asset Strategy simplifies the UKPMS Minimal set to just three codes (UKPMS codes like LK, LF, LV aren't accepted).
For full details, consult the UKPMS user manual.
| Cross Section Position (XSP) | Left | Right | Minimal |
|---|---|---|---|
| Carriageway Centre | CC | — | C |
| Carriageway Lane 1 | CL1 | CR1 | C |
| Carriageway Lane 2 | CL2 | CR2 | C |
| Carriageway Lane 3 | CL3 | CR3 | C |
| Hard Shoulder | LH | RH | C |
| Off Carriageway Position 1 | L1 | R1 | L/R |
| Off Carriageway Position 2 | L2 | R2 | L/R |
| Off Carriageway Position 3 | L3 | R3 | L/R |
Reset Zoom
If you've zoomed into a portion of the graph, you can use this to zoom back out, so that the entire Section length is visible again.
Go to Graph View
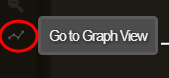
Use this to return to the default Graph View, where parameter values for all XSPs are displayed alongside each other.
Pick Colours
Use this to change the colour of any parameter on the graph.