Graphing
Plot condition data along a Section
Use the Graphing panel to visualise how an asset's condition varies over a Section length for different measurements.
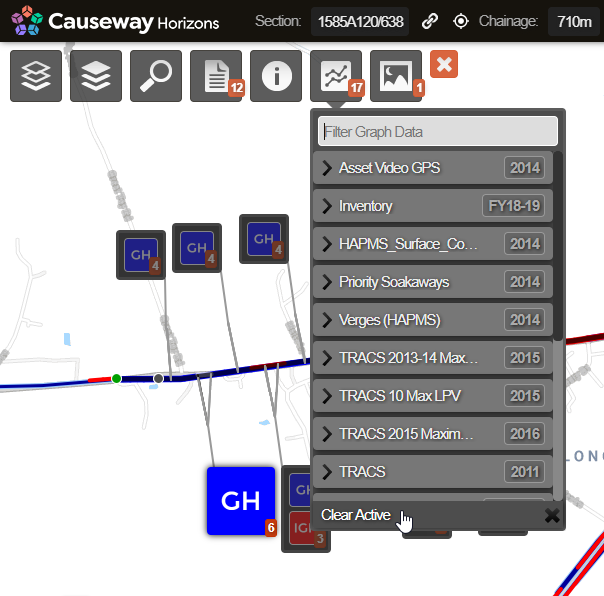
When a Section is selected, the top Graphing icon becomes usable. The badge displayed on the icon indicates the number of available graphing data sources for the active Section. In the dropdown, each available survey type (e.g. TRACS, TSD, SCRIM) and inventory shows as a folder. The Condition Parameters and data items that were collected as part of the survey or inventory are listed within the corresponding folder.
Historical survey information is included for context. This is organised by calendar year to provide the latest data for that year per Section and Cross-Sectional Position (XSP)
Projected future condition is also included for context. This is shown in folders starting with Det Con for Deteriorated Condition. It extrapolates the latest condition survey data using the deterioration curves defined for each Condition Parameter. This provides an indication of the likely rate of deterioration on each Section.
To add a new graphing source, perform a data import with the relevant fields set as Graphable.
Graphing panel
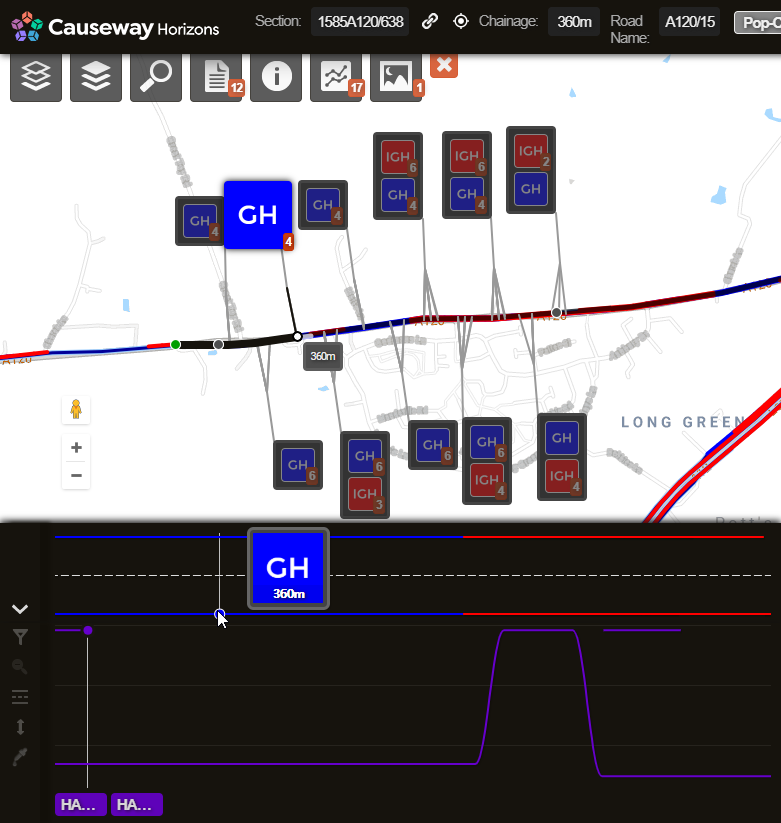
When you select one or more items of graphing data, the Graphing panel appears along the bottom and shows the selected data graphed against the Section's length. Layer data is not plotted on the graph, regardless of which ones are active.
The bottom Graphing panel can be switched between Graph View (default) and XSP View (Cross-Sectional Position).
Graph View displays the overall Section chainage along the horizontal axis and data values along the vertical axis. XSP View displays the data as if looking down on the road from above, with multiple lines representing separate XSP codes, e.g. Left Lane 1, Right Footway,. Therefore, Graph View is typically useful for looking at a road's overall condition, and XSP View is typically useful for looking at which lane (or Feature Code) the data was captured for.
The Condition Parameters selected for display can relate to distinct properties, each with different units, scale and resolution. Multiple distinct parameters (from the same or different surveys) can be viewed in the Graphing panel simultaneously.
The Graphing panel scales the Condition Parameter values to maximise the visible range on the graph. As a result, the values presented in the graph are not to scale by default. To compare condition values with the same units of measure on the same scale, select the Scale to Fit icon.
To increase the availability of data across the Network, imported data is processed using a gap-filling strategy. If a gap is encountered for any single subsection length, it is interpolated using the average of the neighbouring subsections.