Data structure
Understand the data hierarchy
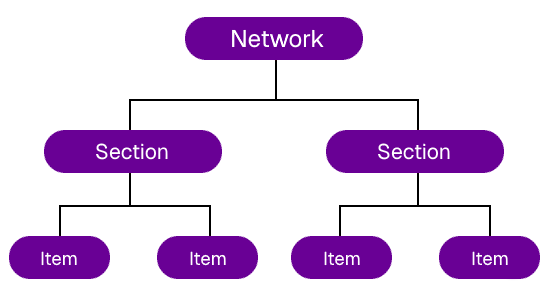
In CausewayOne Asset Strategy, data is organised into three levels:
-
Networks - the areas of asset infrastructure under your organisation's jurisdiction. Each Network is a framework of interconnected lengths, appearing as lines on the map, e.g a highway network.
-
Sections - the individual lengths that make up a Network. Each Section is a discrete unit that data can be stored for, e.g. a stretch of highway.
-
Items - the data on a Section. Each item is a row in a data table that links to a specific Section. Items can describe any type of thing, including assets, survey measurements and condition metrics. To learn more, see Select a Section.
How it all connects
We set up your Networks and divide them into Sections for you, as part of your project configuration. You can then create items by performing data imports, where table rows are mapped to Sections and positioned along them by chainage (a linear distance from the Section start).
To visualise data items on the map, you create Layers. Each Layer applies colour-coded styles to a data source, turning raw data into meaningful map overlays. You can display up to six Layers at once alongside your active Network.
When you select a Section, you can inspect its items in detail, plot its condition data on a graph, view captured imagery and read formatted reports.