Explorer
Browse and visualise your data on the map
The Explorer module opens by default. Browse your Network on an interactive map and visualise your data with colour-coded overlays, including survey data, condition metrics and potential Treatment schemes.
The map operates at two levels. Network Level provides a broad spatial overview of your assets and their data. Zoom in to reach Interaction Level, where individual Sections become selectable and data items are rendered at their true geometry. Select a Section to access detailed information about it, plot condition data along its length and view any captured imagery.
With a Layer, Section or Section item selected, you can access report views of its data for sharing and export.
Features
In the Explorer module, use the floating toolbar to access these features.
Basemaps
Basemaps are the background imagery displayed beneath your data. Several are available, ranging from satellite imagery and hybrid road overlays to plain roadmap and terrain view. Switch between them to see your Network and Layer data in different geographic contexts.
Search
Search your Network to find the location of data. You can search by street address, Section label or data item field. You can also enter specific coordinates. Select a result to zoom the map into its location and automatically select the relevant Section.
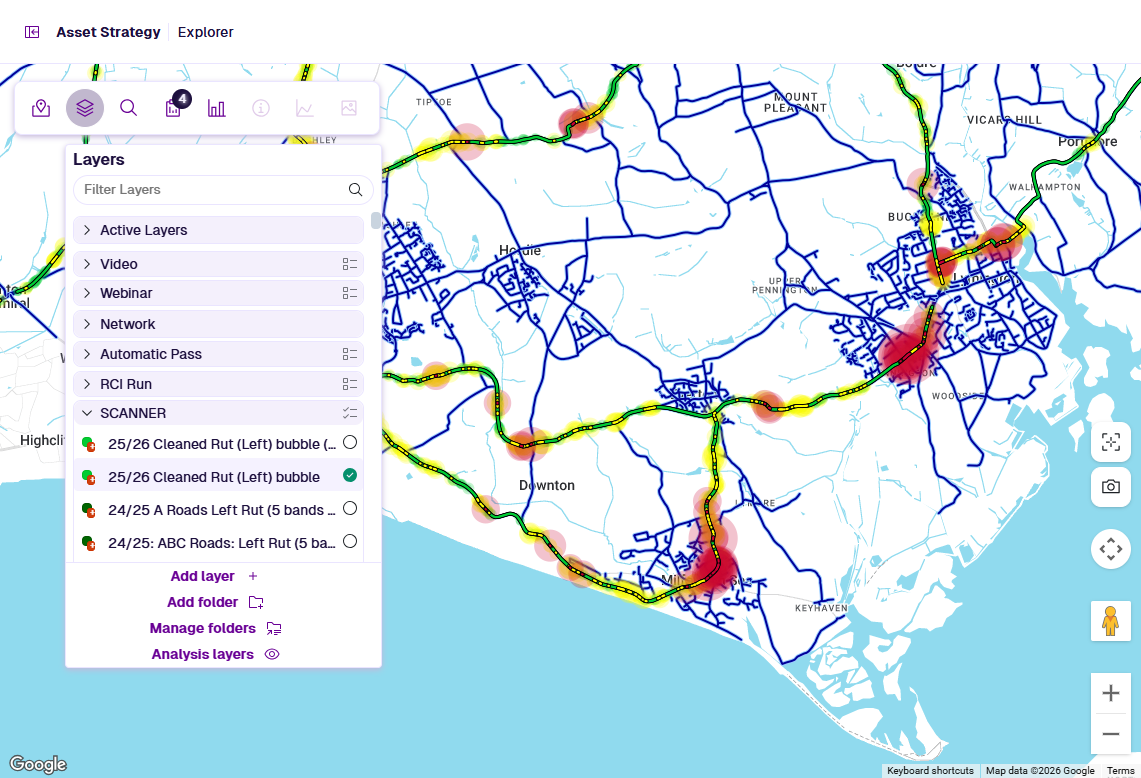
Layers
Layers are data overlays that visualise your Network and its associated data on the map. They're organised into folders according to their source. Each Layer has colour-coded styles to illustrate the possible data ranges. You can create Layers from imported data sources, condition parameters and planned/performed works. Layers are also generated to visualise the results of successfully built Treatment Sets and Works Plans.
Reports
Reports are formal presentations of your data that can be printed or saved as PDF. When a Layer, Section or Section item is selected, corresponding Reports become available. Reports are also generated to showcase the results of successfully built Treatment Sets and Works Plans. Reports range from interactive charts and formatted data tables to plain CSV files.
Section Details
Sections are the individual lengths that make up your Network. At Interaction Level, you can select a Section to view its label, chainage, road number and other information, along with any graphing or imagery data. If the active Layers contain any data items for the Section, they will appear as selectable pop-outs.
Graphing
Graphing data may be available for a selected Section. Using survey data, you can plot the values of multiple Condition Parameters along a horizontal representation of the Section. Parameters are organised by survey type and can be shown in Graph View (condition vs. chainage) or XSP View (cross-sectional road structure). This helps you to visualise the Section's condition and identify problem areas.
Imagery
Imagery data may be available for a selected Section. You can view video feeds and surface scans captured during surveys. The thumbnail panel provides basic playback controls and frame-by-frame navigation of the camera feed. The fullscreen Imagery View provides high-resolution playback, distance measurement and data projection onto the imagery.
Some features may be limited depending on your account access. See Users.
Contents
📄️ Data structure
Understand the data hierarchy
📄️ Map navigation
Explore and zoom the map
📄️ Choose a Network
Work with multiple asset infrastructures
📄️ Select a Section
View detailed information and Layer data
📄️ Basemaps
Change the background imagery
🗃️ Layers
Put data on the map
🗃️ Reports
Presentations of your data at every level
📄️ Search
Find what you need
🗃️ Graphing
Plot condition data along a Section
🗃️ Imagery
View captured video and surface scans