View Treatment Set results
Visualise unconstrained Treatment schemes
After building a Treatment Set that has completed successfully, you can view the results as a Layer on the map. This provides a visualisation of the initial Treatment schemes that were generated. It can provide useful feedback for tweaking the Treatment Set settings and gives you an idea of what a full Works Plan may involve.
However, it's important to emphasise that a Treatment Set is an unconstrained list of works, before any Priorities or Strategies are applied. Therefore, it's often more useful to view the results of a Works Plan based on the Treatment Set (if one exists). See Viewing Works Plan Results.
To learn more about using Layers in the Explorer module, see Layers.
View the results in Explorer
When managing Treatment Sets, open the Complete folder in the left list. Select the relevant Treatment Set and then select the icon at the top.
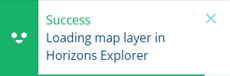
Once you see the following confirmation, switch back to the original Horizons tab in your web browser (which you opened the Analysis Tools from). In that tab, Horizons should automatically switch to the Explorer module and activate the corresponding Treatment Set Layer.
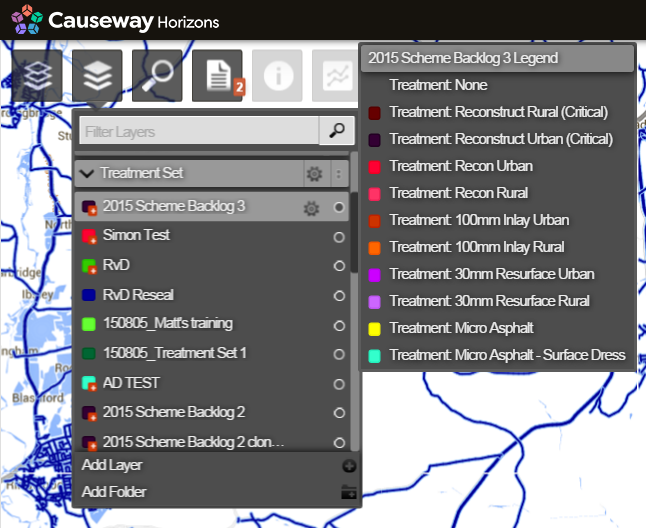
If this fails for whatever reason (e.g. the original Horizons tab was closed), you can do it manually instead. Open Horizons in a new browser tab, click the top Layers icon, open the Treatment Set folder and select the relevant Layer.
Network Level
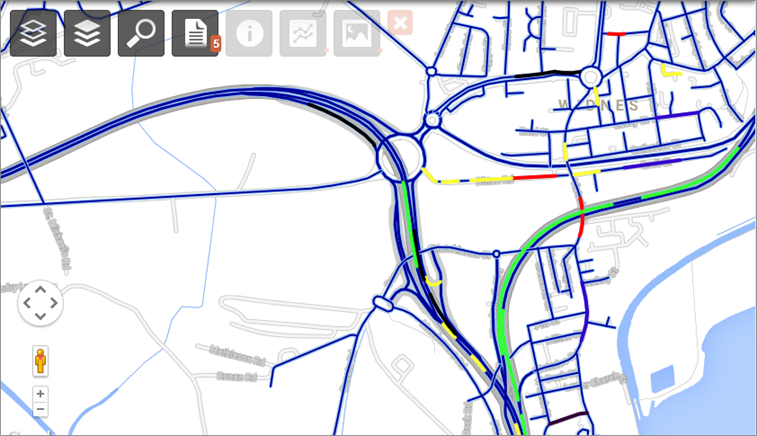
In the Explorer module, navigate the map at Network Level to see an overview of the colour-coded Treatment schemes generated for your assets. To identify which colours represent which Treatments, hover over the Treatment Set Layer in the Layers dropdown.
Select up to six Layers in the dropdown to overlay their data on top of each other. This makes it possible to compare the Treatment Set's results with other datasets, such as:
-
the results of a Works Plan built from it
-
other Treatment Sets
-
condition data
-
statistical data, e.g. accidents, traffic flow
Section Level
To see the Treatment scheme details for a particular asset Section:
-
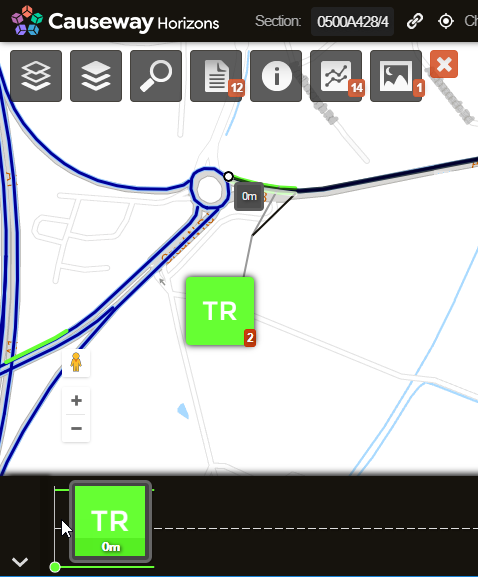
Select the Section you want to examine.
-
Item pop-outs will appear for each Treatment scheme generated along the Section. Select the pop-out you want to examine.
-
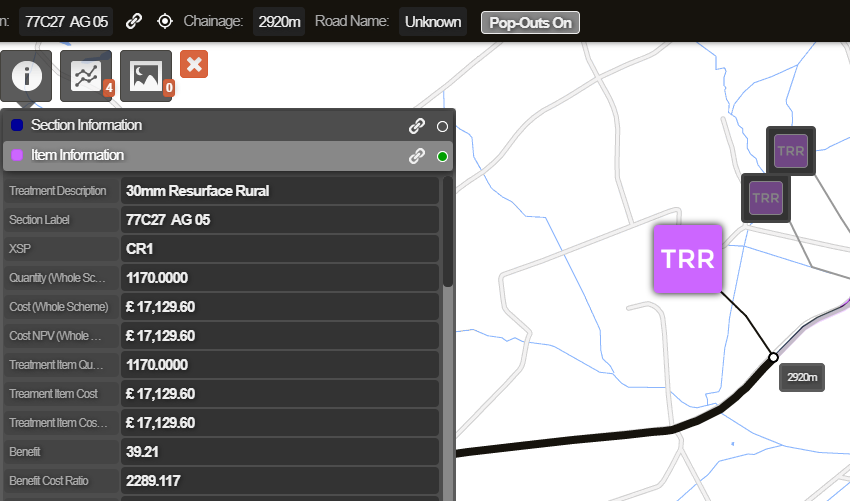
To view detailed information about the selected Treatment scheme (e.g. Cost, Benefit, Efficiency), click the top Information icon and select Item Information.
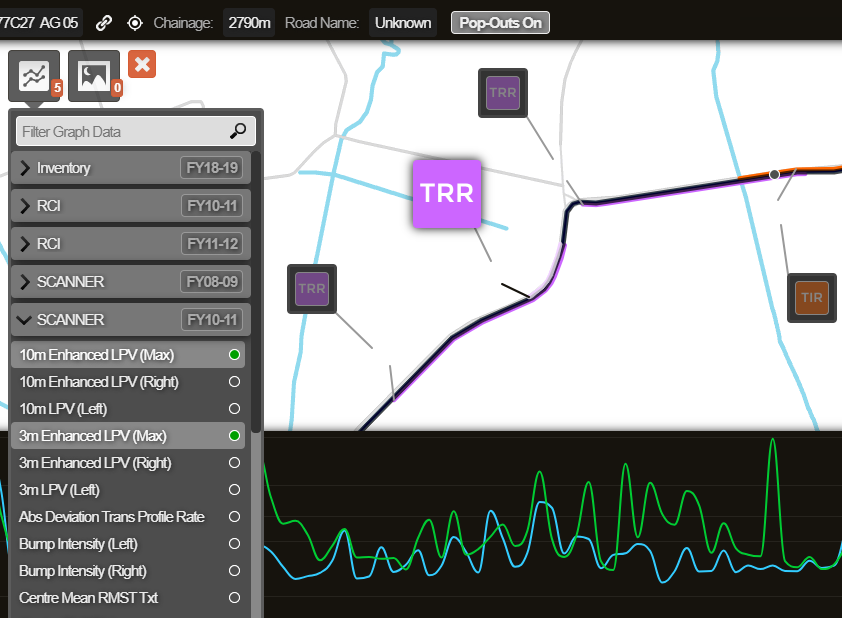
-
To see the Condition Parameter values of the active Section and compare them to the Treatment schemes, click the Graphing icon. You can also use the Imagery icon to view any available photos of the area. To learn more, see Interacting with a Section.