Edit a Condition Parameter
Edit its value range and deterioration curves
For each Condition Parameter in your company project, you can edit the range of accepted values to filter out extreme readings that may distort the analysis. For each applicable Asset Group, you can also define the deterioration curve used to predict future parameter values.
To edit a Condition Parameter:
-
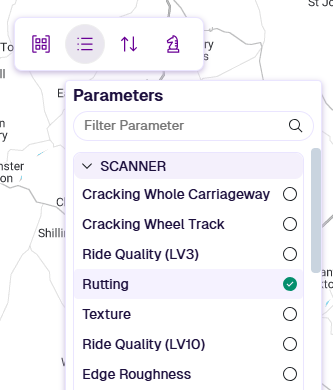
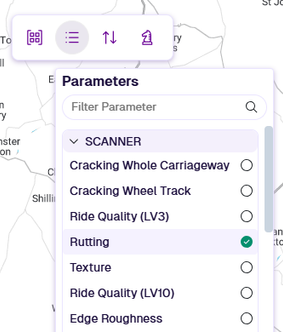
In the Analysis toolbar, select Parameters. Open the folder for the relevant survey type and select the Condition Parameter to edit.
-
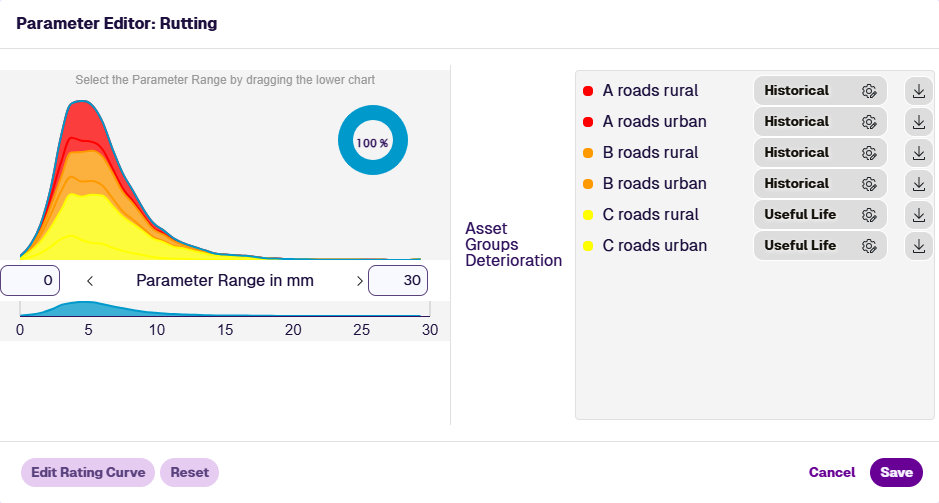
In the Parameter Editor, Asset Groups with data for the Condition Parameter are listed on the right. The left chart shows the distribution of parameter values across all data sources, with a coloured area for each group. The mini chart beneath spans the complete range of values. The Parameter Range boxes show the currently accepted range.
In the example below, the Parameter Range is set between
0and30millimetres (full range). Any values beyond 30 mm are therefore treated as 30 mm by the model. The top-right doughnut indicates that 100% of values currently fall within this range.
-
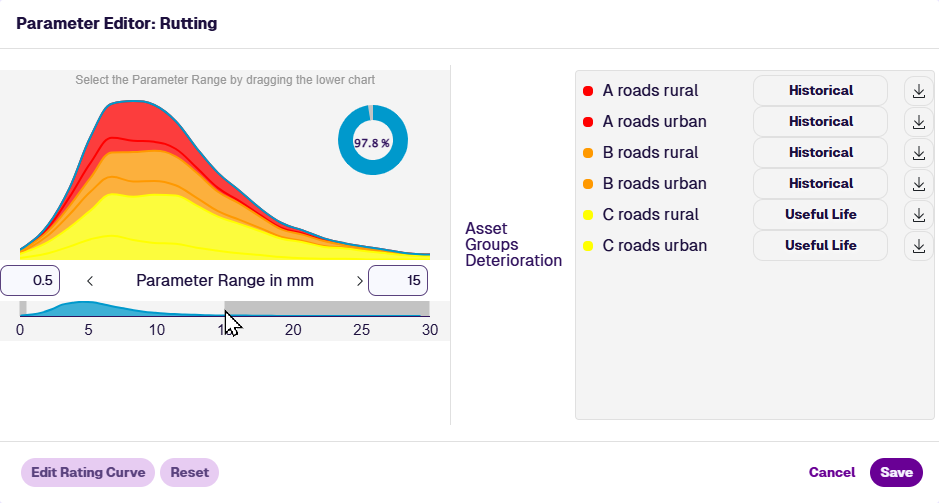
To edit the Parameter Range, enter new start and end values into the boxes, or drag a selection along the mini chart beneath. The chart and doughnut update to illustrate the new range. Select Reset to revert your changes.
Select Save to finish. This will recalculate the deterioration curves of the listed Asset Groups.
ImportantChanging the Parameter Range can make existing Treatments and Treatment Sets incompatible. Read any warnings carefully!

-
To edit the deterioration curve of an Asset Group, select its Edit button. If the button isn't visible, the Parameter Range is currently modified. Select Reset or Save to proceed.