View Works Plan Results
Visualise refined Treatment schemes on the map
Once a Works Plan is successfully built, you can view the results of the recommended scenario as Layers on the map. This is typically the cheapest scenario that meets the most targets. A Layer is created for each financial year in the scenario (as configured in the Works Plan settings).
Each Works Plan Layer provides a visualisation of the refined Treatment schemes for that year, which were selected to meet the configured Budgets, Strategies and Priorities.
At a Network level, it displays the geographical allocation of maintenance efforts and costs, which can highlight problematic or high-traffic areas. At a Section level, it lets you see the details of each Treatment alongside local Condition Parameter values and other data items.
To learn more about using Layers in Explorer, see Layers.
View results in Explorer
To view the results of a Works Plan:
-
Select Analysis Tools > Works Plans in the left panel.
-
Open the Complete folder and select a Works Plan.
-
Select View in Explorer in the top-right corner.
The Works Plan's first-year Layer is activated in Explorer and appears on the map. To view other years, select Layers in the Explorer toolbar and open the folder named after the Works Plan.
Network Level
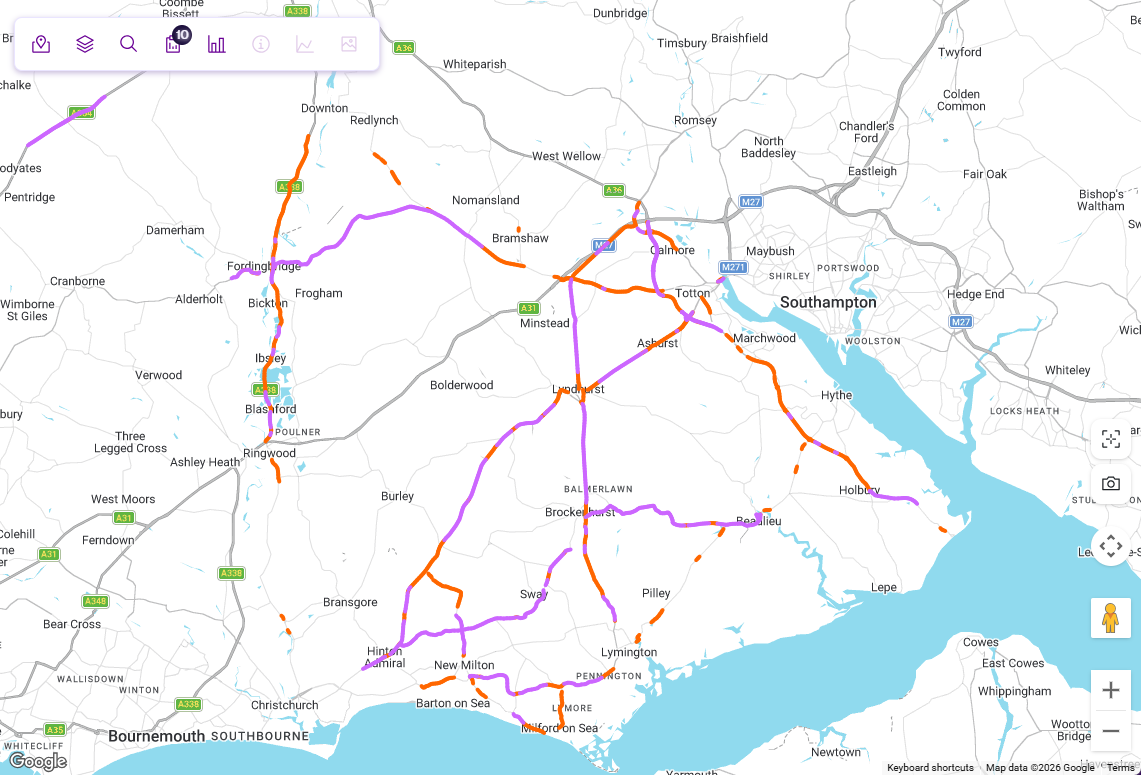
In Explorer, navigate the map at Network Level to see an overview of the colour-coded Treatment schemes generated for your assets. To see the colour key, select Layers in the Explorer toolbar, open the Works Plan's folder, then hover over the corresponding Layer.
Select up to six Layers in the dropdown to overlay their data on top of each other. This lets you compare the financial years of a Works Plan. It also lets you compare the Works Plan results with other datasets, such as:
-
the unrefined results of the source Treatment Set
-
other Works Plans
-
condition data
-
statistical data, e.g. accidents, traffic flow
To filter all Layer data by Subnetwork, select one in the Networks folder of the Layers dropdown.
Section Level
To see the Treatment scheme details for a specific Section:
-
Select the Section you want to examine.
-
Item pop-outs will appear for each Treatment scheme generated along the Section. Select the pop-out you want to examine.
-
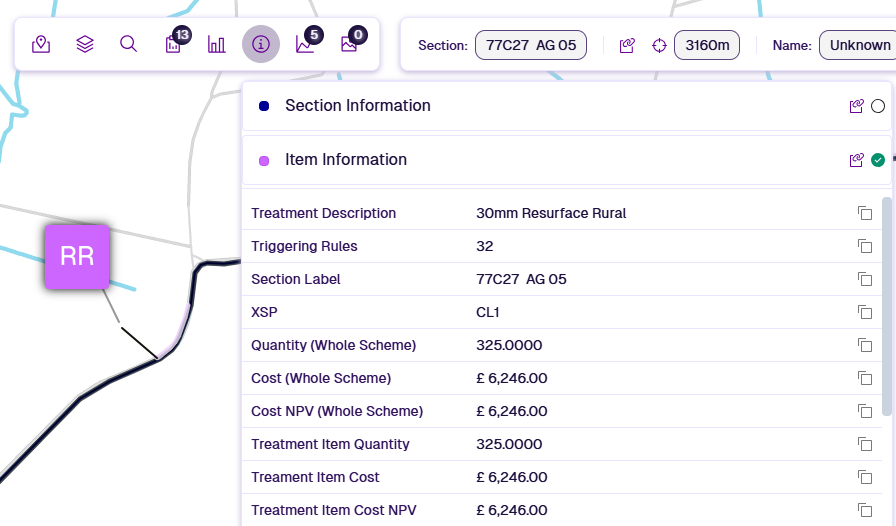
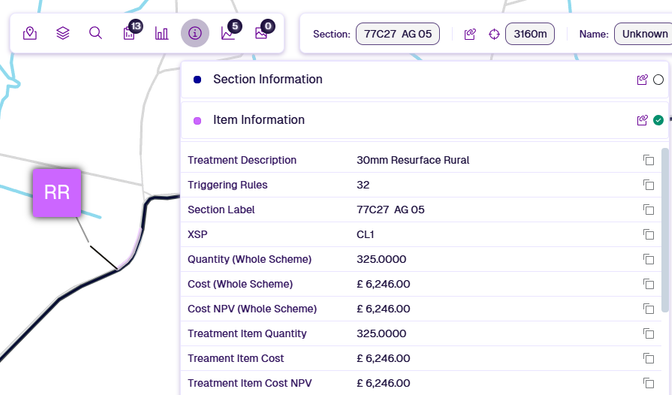
To view detailed information about the selected Treatment scheme, select Section Details in the Explorer toolbar, then select Item Information.
-
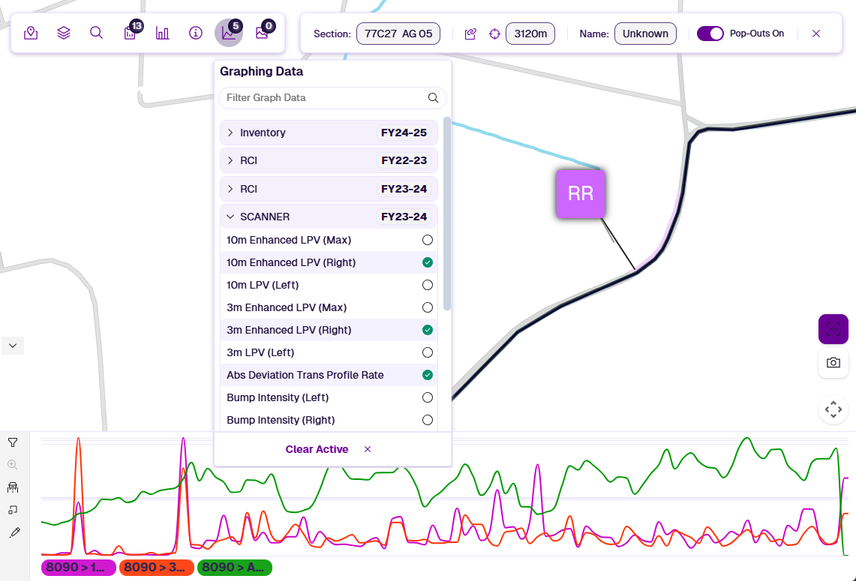
To see the Condition Parameter values of the active Section and compare them to the Treatment schemes, select Graphing in the Explorer toolbar. Select Imagery to view any available photos of the area.