Treatment Set Reports
Review initial Treatment schemes in detail
Once a Treatment Set is successfully built, you can view the results in a set of detailed Reports. This can provide useful feedback for refining the Treatment Set settings and gives you an idea of what a full Works Plan may involve.
A completed Treatment Set is an unconstrained list of works, before any Budgets, Priorities or Strategies are applied. Therefore, treat the results as an initial preview!
To learn more about viewing Reports in Explorer, see Reports.
View Reports
To view the Reports for a Treatment Set:
-
Select Analysis Tools > Treatment Sets in the left panel.
-
Open the Complete folder and select a Treatment Set.
-
Select View Treatment Set Report in the top-right corner.
The Treatment Set Summary Report opens in a new window.
Treatment Set Summary
This provides key details about the Treatment Set's configuration and how its results were generated, including the costs and required quantities of each Treatment. Like all Reports, you can print and export its content for use outside of CausewayOne Asset Strategy.
Linked Reports
The Treatment Set Summary links to several related Reports:
-
Treatment Set Parameters - the details of each Condition Parameter analysed by the Treatment Set and how their deterioration was calculated for each Asset Group.
-
Treatment Set Thresholds - the Condition Parameter severity thresholds set for each Asset Group in the Treatment Set.
-
Treatment Set Rules - the trigger rules defined for each Treatment in the set.
-
Treatment Set Configuration - the details of each Treatment in the set, including their permitted length, emissions, applicable Asset Groups, costs and effects on Condition Parameters.
Report actions
When viewing a Report, you can perform these actions:
-
Report Link - share the Report with users in your company project. Right-click the highlighted URL and choose Copy or press Ctrl+C. Anyone who follows the link must sign into CausewayOne Asset Strategy before the Report is displayed.
-
Open in New Window - view the Report in a new browser tab, where it fills the entire window.
-
Print - open the print dialog. To save the Report as a PDF, choose a virtual PDF printer (if available).
-
Done - close the Report window.
Network Reports
To access all Reports for the Treatment Set, select Done to close the Treatment Set Summary. In the Explorer toolbar, select Reports and open the folder named after the Treatment Set.
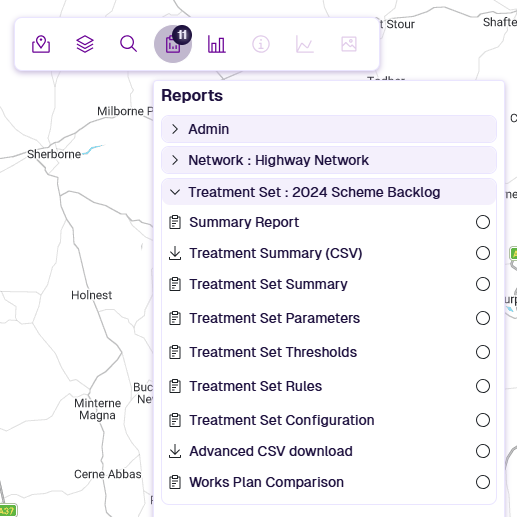
The following extra Reports are available:
-
Summary Report - an interactive summary chart that provides a quick visual display of the Treatment counts and overall Treatment lengths for the selected Network or Subnetwork. See Summary Reports.
-
Treatment Summary (CSV) - download a CSV spreadsheet containing the data of all Treatment schemes selected by the Treatment Set (e.g. Section Label, Start/End Chainage, XSP Code, Description, Quantity, Cost). This information is similar to the Treatment Summary (CSV) Report of a Works Plan, but without any Strategies and Priorities applied, and only for the current financial year.
Field details
The Treatment Summary CSV includes fields that describe how Treatments were selected and prioritised. These fields are included when you export a Treatment Set or Works Plan Layer. See Exporting Layers.
Treatment Summary Label Exported Layer Label Description Scheme_Priority sch_prio The order of schemes based on specific criteria that vary by scenario type.
Worst First:
- future Works done
- whether the scheme meets the minimum length
- condition score (largest first)
- Treatment cost (smallest first)
Other Scenarios:
- future works done
- whether the scheme meets the minimum length
- whether a more severe scheme will be needed next year (asset sweating)
- Benefit Cost Ratio (largest first)
- Treatment cost (smallest first)
Condition Priority con_prio Condition Priority ranking is based on Benefit Cost Ratio.
To determine a Treatment's BCR, the system first calculates its beneficial effect on each Condition Parameter for each subsection, then averages these to get a mean benefit per subsection. The mean benefits across all subsections in the scheme are summed and divided by the scheme cost, then multiplied by the Treatment's BCR scale factor setting.
Schemes are then ordered by Treatment BCR to determine the Condition Priority. Where two schemes have the same Treatment BCR, the least costly scheme takes higher priority. If a Works Layer was provided, any future works defined in it will always take highest priority.
Condition Score con_score A value between 0 and 1 representing asset condition. Each Condition Parameter is rated using its deterioration curve. The Condition Score is the mean of those ratings across all subsections in the scheme.
-
Advanced CSV download - download one of several CSV spreadsheets, containing detailed data for:
-
Selected Schemes - including the reason why each scheme was selected.
-
Deferred Schemes - including the reason why each scheme was deferred (e.g. shorter than the Treatment's minimum length).
-
Multiple Treatment Sections
-
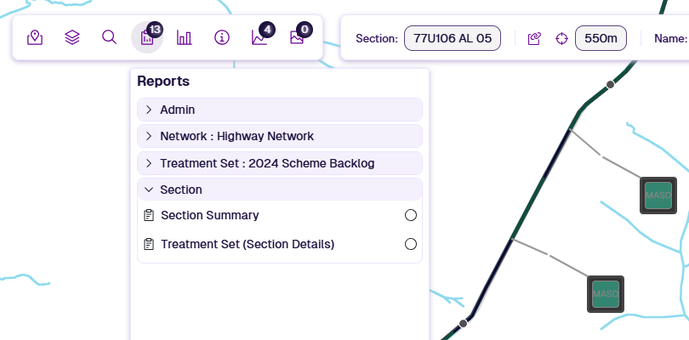
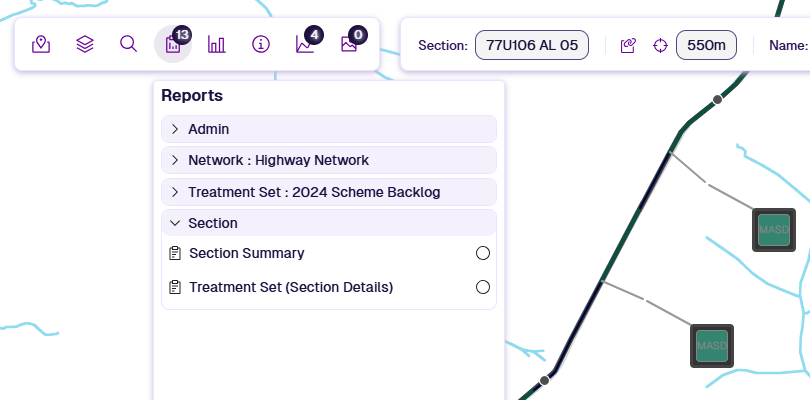
Section Report
To view the Treatment Set details for a specific Section:
-
Select the Section you want to examine.
-
In the Explorer toolbar, select Reports, open the Section folder and select Treatment Set (Section Details). If it isn't listed, ensure the correct Network Layer is selected.
-
The Report displays key information about the Treatment Set on that Section, including linear illustrations of the generated Treatment schemes.
Select an XSP code on the left to open the corresponding Section Treatment Details Report, which includes comprehensive illustrations of deterioration data for the relevant Condition Parameters, the triggered Treatments, and how those Treatments were selected and merged.
Common XSP Codes
An XSP (Cross Section Position) describes where something sits across the width of a road.
Carriageway lanes are numbered from the nearside edge toward the centre. For single carriageways, use
CLcodes only. Features outside the carriageway (kerbs, footways, verges) use Off Carriageway Position codes, numbered outward from the carriageway.Minimal codes give a generic position for the whole carriageway or one side when precise position isn't important. Asset Strategy simplifies the UKPMS Minimal set to just three codes (UKPMS codes like
LK,LF,LVaren't accepted).For full details, consult the UKPMS user manual.
Cross Section Position (XSP) Left Right Minimal Carriageway Centre CC — C Carriageway Lane 1 CL1 CR1 C Carriageway Lane 2 CL2 CR2 C Carriageway Lane 3 CL3 CR3 C Hard Shoulder LH RH C Off Carriageway Position 1 L1 R1 L/R Off Carriageway Position 2 L2 R2 L/R Off Carriageway Position 3 L3 R3 L/R 
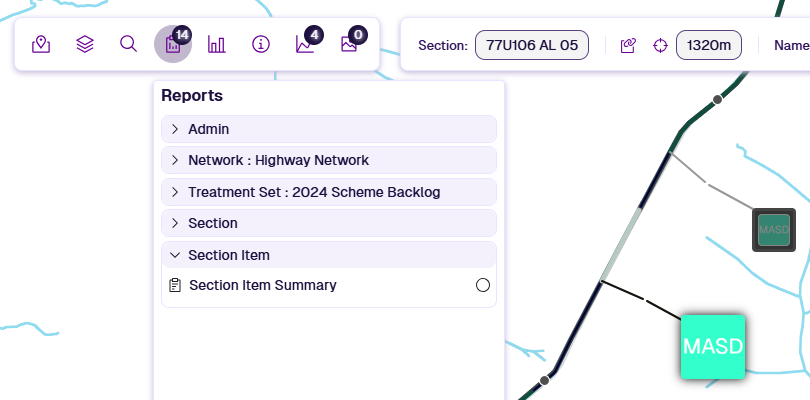
Section Item Report
To view the details of a Treatment scheme on a Section:
-
Select the Section you want to examine.
-
Item pop-outs appear for each Treatment scheme generated along the Section. Select the pop-out you want to examine.
-
In the Explorer toolbar, select Reports, open the Section Item folder and select Section Item Summary. This Report includes a range of information about the selected Treatment item, e.g. Section Label, Start/End Chainage, XSP Code, Description, Quantity, Cost.