Create a Treatment Set
Define a hierarchy of Treatments and trigger rules
To create and configure a new Treatment Set, select Analysis Tools > Treatment Sets in the left panel, then Create Treatment Set in the top-right corner.
Fill in the form sequentially. The values you set will determine the fields shown in the next section. Fields marked with an asterisk * require a value to continue. After completing the first two sections, you can select Save on the right to save your progress. To exit without saving, select Close in the top-right corner.
Treatment Sets use the following features, so make sure they're set up correctly before getting started:
1 Details
Choose the Network to analyse. Supply data for any completed or planned works. Configure how Sections should be split into subsections and whether to deteriorate condition data:
-
Name * - enter a distinct name that clearly identifies the Treatment Set.
-
Select asset class * - choose the asset class that the Treatment Set should apply to, e.g. Carriageway, Kerb.
-
Filter Network * - choose the Network Layer that the Treatment Set - and any Works Plans based on it - should apply to. This can be your entire asset Network, a Subnetwork area within it, or a Section Merge Layer (a version of your Network where some adjacent Sections are merged into longer "Super-Sections").
infoWhen editing or cloning a Treatment Set, if this setting references a historic Network Layer that was archived, you must choose a new one.
-
Works layer - choose a Layer containing data about any completed or planned works within the chosen Network (if available). This improves deterioration calculation and avoids Treatments that could clash with other works.
-
Subsection length (m) * - during analysis, each Section is divided into fixed-length subsections. The shorter the subsection length, the finer the analysis will be. Specify a length in metres that balances the resolution of your survey data against the efficiency of processing the data.
-
Minimum subsection length (m) * - when Sections are divided into subsections, there's often a remainder at the end. Specify a minimum length in metres. If the remainder is shorter than this, it'll be merged into the previous subsection. Otherwise, the remainder will be its own short subsection at the end.
-
Deteriorate to date * - for consistency, you can deteriorate all assets to a common start date. The Condition Parameter values of each subsection will be calculated using survey data, deterioration curves and the Works Layer (if provided). Choose an option:
-
None - no initial asset deterioration. Each subsection will use the latest Condition Parameter values available for it, regardless of how old the data is.
-
to FY / Latest Survey - on each subsection, Condition Parameter values will be deteriorated to the start of the current financial year, or to the date of newer survey data (if available).
-
to Specific Date - on each subsection, Condition Parameter values will be deteriorated to a specific date in the current financial year. If newer survey data becomes available, this date will be updated automatically.
infoWhen editing/cloning a Treatment Set, if this points to an old Specific Date, it'll be updated to the start of the current financial year.
-
-
Alternative Treatments - enabled by default. When a Treatment is triggered for a subsection, it can be replaced with another Treatment in the same hierarchy chain that provides a better Benefit-Cost Ratio (BCR). The alternative may be more severe (expensive but longer-lasting) or less severe (cheaper but less durable). If disabled, the highest triggered Treatment in the hierarchy chain is always used.
Details
Imagine a Treatment Set with the hierarchy illustrated below. Treatments
BandEare triggered on a subsection. By default,Bis selected because it's higher in the chain (more severe). But with Alternative Treatments enabled,Eis selected because its BCR score is higher.But what if multiple Treatments have the same BCR score? Imagine a different subsection where Treatments
CandFare triggered. With Alternative Treatments enabled,Fis selected despite being lower in the chain (less severe), because it's presumed to be cheaper.
Merge details
Configure how subsections will be merged into optimised Treatment schemes:
-
Whole section merge - disabled by default. Subsections will be merged according to the Merge when setting of the Treatment itself. This may create Treatment schemes that only cover part of a Section.
If enabled, subsections will be merged differently. This will create Treatment schemes that span the full length of the Section. A scheme will be created for the highest triggered Treatment in each hierarchy chain, known as the dominant Treatment.
Details
Imagine a Treatment Set with the hierarchies illustrated below. Imagine a long Section with subsections that collectively trigger all the Treatments coloured below:
With Whole section merge enabled, a full-length scheme is created for the highest triggered Treatment in each hierarchy chain:
Treatments
C1andC2are suppressed byB1.C3is suppressed byB2. AsB1andB2are at the same level in the hierarchy, they can co-exist. In the second hierarchy, onlyZ2was triggered.Therefore, the dominant Treatments are
B1,B2andZ2.infoIf Merge short Treatments is also enabled, a full-length scheme will be generated for every triggered Treatment, not just the dominant ones. However, child Treatment schemes cannot exist on the same Section as their parent - any that do will be discarded.
ImportantIf a Treatment has its Merge when setting set to Efficiency, ensure it can accommodate full-length schemes. Its Treatment length max setting should also be long enough.
For example, imagine a Treatment with 60% efficiency and a 1000 m Section. With Whole section merge enabled, a full-length scheme will only be generated if the Treatment is triggered on over 600 m.
-
Merge short Treatments - after subsections have been merged into Treatment schemes, some may be shorter than their Treatment length min setting. If enabled, these short schemes will be merged into other Treatment schemes. If disabled, short schemes will be discarded.
Details
With Merge short Treatments enabled, subsections are merged into Treatment schemes according to these rules:
- At least one scheme must be "short" (less than its Treatment length min).
- At least one of the original triggered Treatments must fulfil its Merge when setting (Efficiency or Proximity).
- The Treatment triggered by the most original subsections becomes the dominant Treatment for the merged scheme. If it's a draw, the one with the higher Benefit-Cost Ratio (BCR) becomes dominant.
- The merged scheme must be valid for all the Asset Groups it spans.
In the example illustrated below, there are four subsections with schemes for Treatments
A,BandC. Their BCR scores are0.5,0.4and0.6respectively. Their Merge when setting is Efficiency ≥ 45%.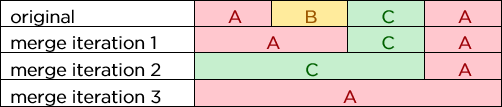
First, the
AandBschemes are merged. Both are short (rule i) and would occupy 50% of the merged scheme (rule ii). Both were triggered once butAhas the better BCR score, so it becomes the dominant Treatment for the merged scheme (rule iii).Next, the merged
Ascheme is merged with the shortCscheme. Looking at the three original subsections,A,BandCwere all triggered once butChas the better BCR score, so it becomes the dominant Treatment.Finally, the merged
Cscheme is merged with the other shortAscheme. Looking at all four original subsections,Awas triggered twice, so it becomes the dominant Treatment.For each iteration, the merged scheme is allowed because all three Treatments are valid for the underlying Asset Groups that it spans (rule iv).
ImportantThis can significantly increase the processing time of the Treatment Set and any Works Plans that use it!
-
XSP Merging * - asset surveys are often performed on a single XSP, e.g. carriageway lane. If data is unavailable for the other lanes, it can be assumed that their condition is similar to the surveyed lane. For each Section, schemes can be merged across lanes using the chosen method:
-
None - schemes won't be merged across any lanes.
-
Directional - schemes will only be merged across lanes flowing in the same direction (same carriageway).
-
All - schemes will be merged across all lanes, regardless of direction (both carriageways).
On road assets, the entire carriageway is typically treated at once. Therefore, merging Treatment schemes across its lanes can provide you with more accurate budgeting data!
Details
Schemes are merged across the XSPs of a Section according to these rules:
- A scheme can be merged across an XSP with no condition data.
- A more severe scheme can be merged across an XSP with a less severe scheme.
- A scheme cannot be merged across an XSP if the Treatment isn't valid for the Asset Groups along its length.
The examples illustrated below show a road asset with two carriageways (left/right) containing two lanes each (some omitted for brevity). If XSP Merging is set to All, Treatment scheme
Ais merged across all XSPs, including those without condition data (rule i).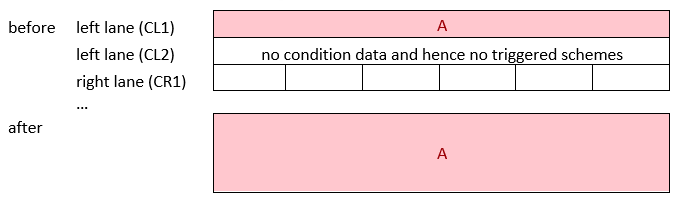
Where schemes overlap across different XSPs, they're merged to the fullest extent.
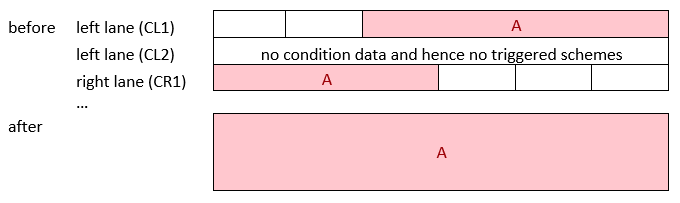
Less severe schemes are truncated or overwritten by more severe schemes (rule ii).
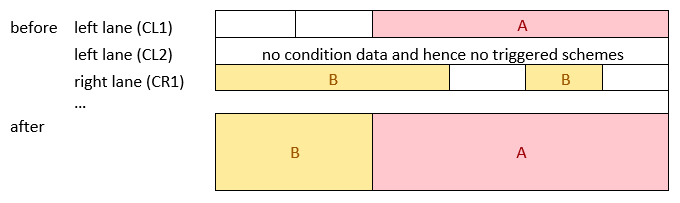
If the Asset Group of an XSP isn't valid for the scheme's Treatment, it will be skipped. In this example, the verge is represented. It's made of concrete and Treatment
Ais bituminous, so the verge isn't included in the merge!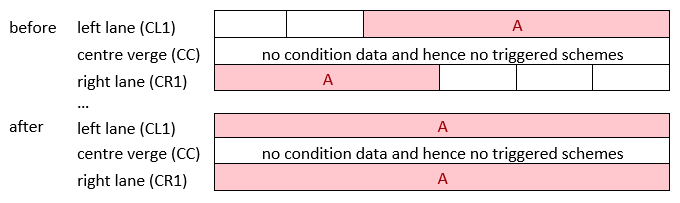
-
2 Asset groups and parameters
Choose which assets should be analysed and what condition data should be tracked:
-
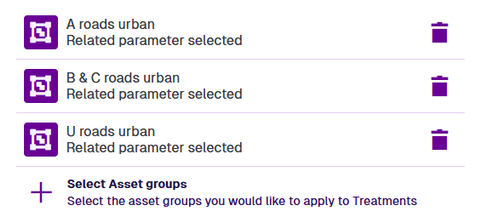
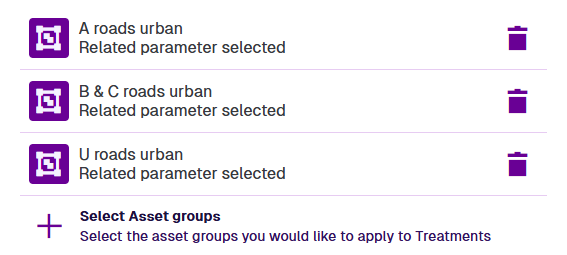
Select Asset groups - lists the available Asset Groups for the chosen asset class. Select the ones the Treatment Set should apply to. You can save the Treatment Set once a valid Condition Parameter is selected for each Asset Group.
To remove an Asset Group from the Treatment Set, select Delete. This also removes any related Condition Parameters, Treatments or trigger rules that are now redundant.
-
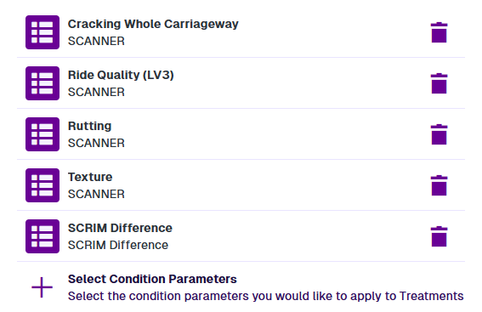
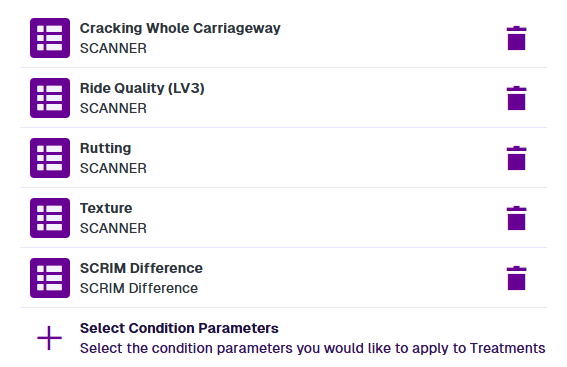
Select Condition Parameters - browse the available Condition Parameters for the selected Asset Groups. Select the ones that the Treatment Set should analyse on the assets of the chosen Network. They are categorised by survey method, e.g. SCANNER, CVI/DVI.
In the picker, select Open beside a folder to list the Condition Parameters for that survey method. Select one or more and then select Surveys to go back. Repeat as needed and then select Save to finish.
To remove a Condition Parameter from the Treatment Set, select Delete. This also removes any related Treatments or trigger rules that are now redundant.
3 Severity bands
Configure the severity bands for each selected Condition Parameter, on each selected Asset Group it applies to. You can partition the possible value range up to four times, resulting in up to five automatically coloured bands.
Traffic light colours indicate ascending severity from green (good) to orange (ok) to red (bad). The order is reversed for Condition Parameters with descending severity, where higher values are better, e.g. Texture (mm).
Use the buttons to adjust the number of severity bands between two and five. You can do this at any time. If any Treatment rules are set, their band will be adjusted automatically, but make sure they are still fit for purpose!
Threshold values
Each severity band has a threshold value that determines its range. When the Condition Parameter is equal to or greater than the threshold, but less than the next band's threshold, it will be classed as that severity.
By default, band thresholds are calculated automatically for all Asset Groups, with equal distribution from the Min to Max value. They are recalculated whenever the number of bands is adjusted.
To set a manual threshold for a severity band on an Asset Group, select its number field, enter a new value and press the Enter key (or select anywhere else). Remember, thresholds are inclusive of the entered value! To set the same threshold for a severity band on all Asset Groups, select the coloured bar and choose Fill column. Alternatively, choose Remove column to remove that severity band without affecting the other thresholds.
Once a manual threshold has been set, it will remain at that value, even if the number of severity bands is adjusted.
Setting bands too low may trigger Treatments earlier than necessary, reducing cost efficiency. However, setting bands too high may trigger Treatments too late, resulting in excessive deterioration that may be costly to fix! You can experiment with setting these values while the Treatment Set is a draft. Once a Treatment Set is completed or aborted, it can't be edited directly, though you can create a clone of it instead.
Example details
| Asset Group | Band 1 | Band 2 | Band 3 | Band 4 |
|---|---|---|---|---|
| AU | 0 to <1 | 1 to <3 | 3 to <4 | 4 to 5 |
| BCU | 0 to <2 | 2 to <3 | 3 to <4 | 4 to 5 |
| UR | 0 to <3 | 3 to <4 | 4 to <4.5 | 4.5 to 5 |
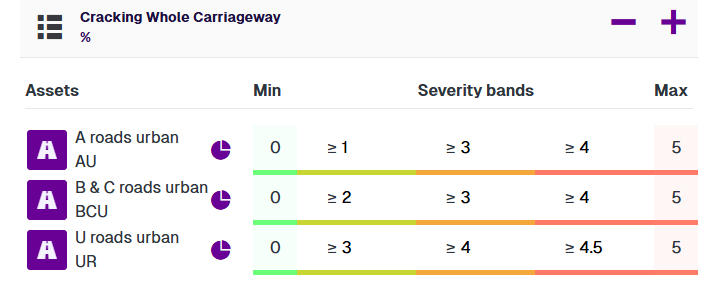
To adjust the Min and Max values, edit the range of the Condition Parameter.
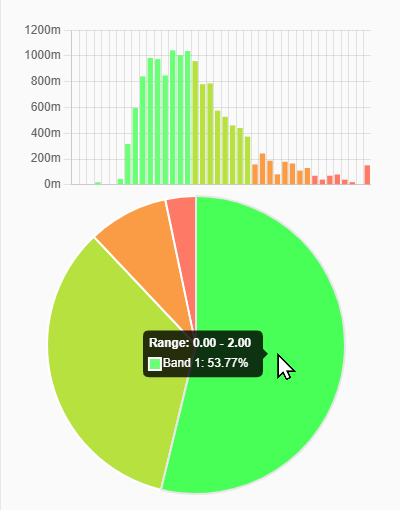
Distribution charts
To help you decide how many severity bands a Condition Parameter should have, and the threshold values they should have, you can view colour-coded distribution charts for each Asset Group. The charts depict the distribution of values within the available survey data for each configured severity band, according to the current thresholds.
To see the distribution charts for an Asset Group, select Chart. A bar chart and pie chart appear on the right.
In the bar chart, the x-axis shows the range of possible values and the y-axis shows the combined length of all asset subsections that have each value. Hover over a bar to see the actual values it represents. In the pie chart, each slice represents the percentage of values that fall within the corresponding severity band. Hover over a slice to see the actual percentage.
As you configure the severity bands, the charts will update automatically to provide a live visualisation of the data spread. Select Chart again to close them.
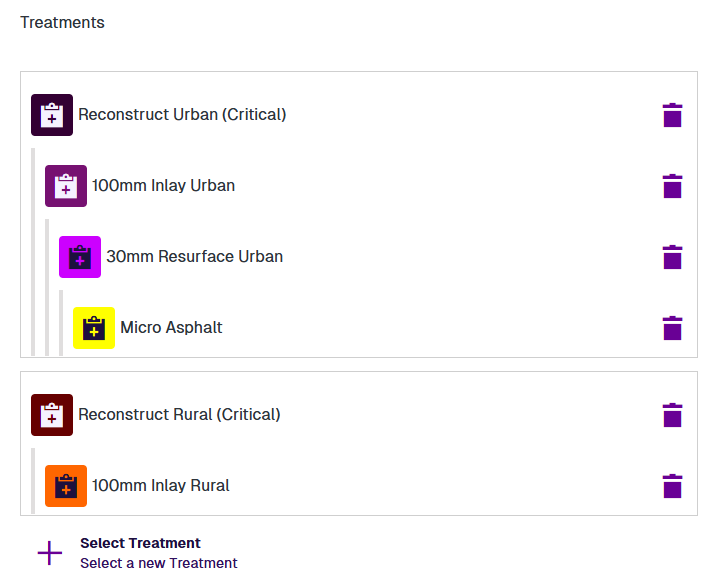
4 Select Treatments
Select the possible Treatments that the Treatment Set should offer and arrange them in descending order of severity.
Add a Treatment
Use the Select Treatment button to list the available Treatments for the Asset Groups selected in section 2. After choosing a Treatment, an overlay will appear to let you configure its rules and view its projected lifespan:
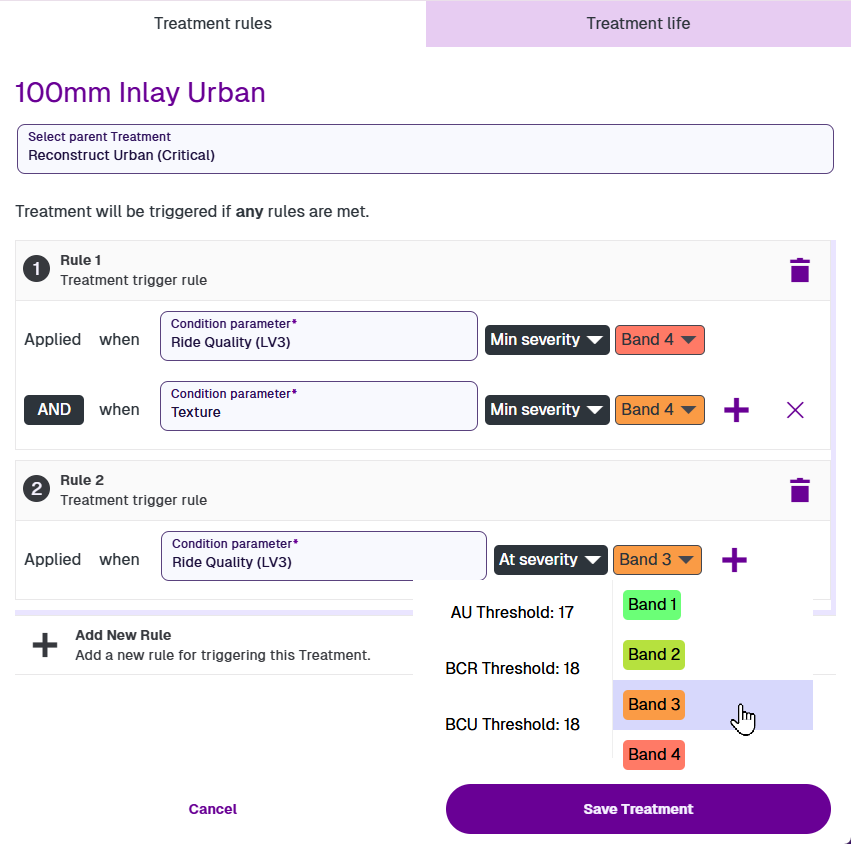
Treatment rules
Use this tab to configure the Treatment's parent and trigger rules:
-
Select Parent Treatment - optionally link this Treatment to a more severe variant in the set. Arrange Treatments into hierarchies in descending order of severity. During analysis, this helps determine the most appropriate Treatment for each asset subsection.
-
Rules - add one or more rules to define the conditions needed to trigger the Treatment (if any one rule is met). Select Add New Rule, choose the relevant Condition parameter, and then choose one of the following:
-
Min severity - trigger the Treatment if the parameter value falls within the chosen band or worse.
-
At severity - trigger the Treatment if the parameter value falls within the chosen band only.
To add another condition to the rule, select Add beside the last one. All conditions must be met for the rule to be triggered.
-
If the number of severity bands changes for a Condition Parameter, rules adjust automatically, e.g. if a rule is set to "Band 3", and the number of bands is increased to four, the rule is adjusted to "Band 4".
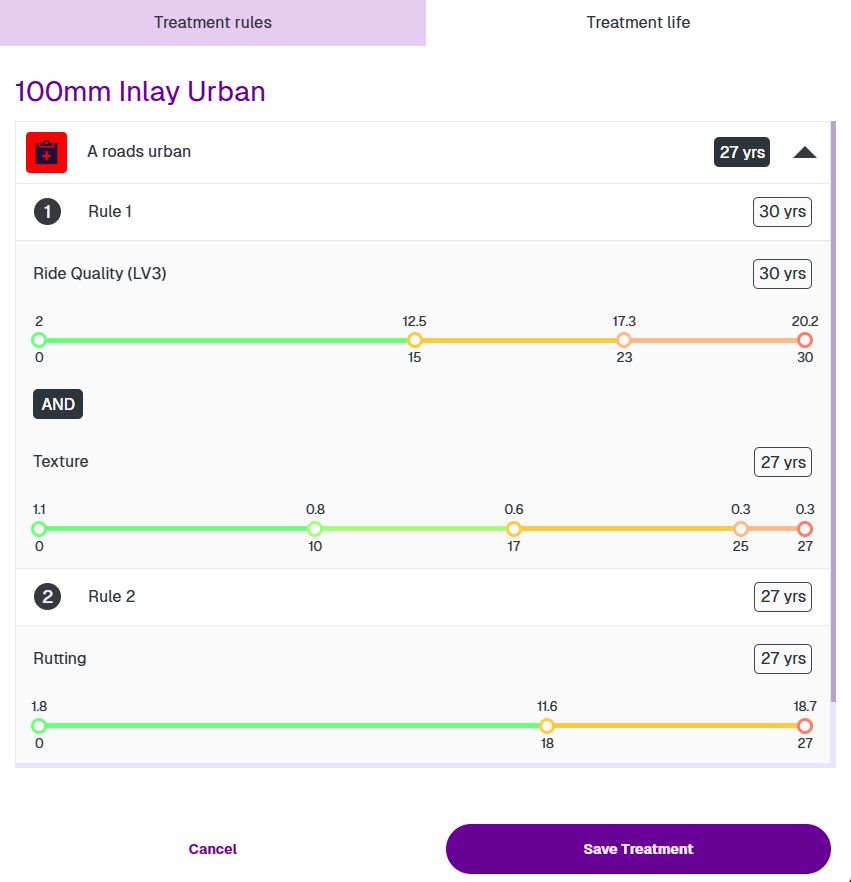
Treatment life
Use this tab to view the estimated lifespan of the Treatment on each Asset Group.
The number of years the Treatment will remain effective is calculated from the rules configured on this Treatment Set, the effects defined on the Treatment, and the deterioration curve of each Condition Parameter.
Select an Asset Group to see a breakdown of the estimated lifespans for each applicable rule. A coloured line is shown for each Condition Parameter, which indicates its projected severity over time. Hover over the numbers for more detail. The shortest lifespan is used to represent the Treatment on the Asset Group overall.
Treatment Life does not apply to Opex Treatments.
After configuring rules for the chosen Treatment, select Save Treatment to finish. The Treatment will now be listed in the hierarchy, beneath whatever parent was chosen on the Treatment rules tab.
Treatment hierarchies
During analysis, if multiple Treatments are triggered for a subsection, the highest Treatment in the hierarchy chain is selected by default. If Alternative Treatments is enabled, a more cost-effective variant in the chain may be selected instead. Depending on the Merge details of the Treatment Set, the subsection may ultimately be merged into a more severe Treatment scheme.
Select a Treatment to edit its trigger rules or view its projected lifespan. To remove a Treatment from the set, select Delete. If it has any child Treatments, they will remain in the hierarchy (under the next parent).